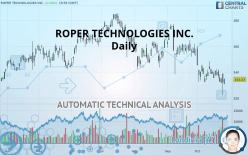
ROPER TECHNOLOGIES INC. - Daily - Technical analysis published on 10/28/2019 (GMT)
- Who voted?
- 272
- 0
I am delighted to see that my first price objective has been achieved. I hope you've taken advantage of it.
Click here for a new analysis!
Click here for a new analysis!
- Timeframe : Daily
- - Analysis generated on
- Status : TARGET REACHED

Summary of the analysis
Trends
Court terme:
Strongly bearish
De fond:
Strongly bearish
Technical indicators
39%
39%
22%
My opinion
Bearish under 344.06 USD
My targets
332.58 USD (-0.57%)
311.51 USD (-6.86%)
My analysis
The bearish trend is currently very strong for ROPER TECHNOLOGIES INC.. As long as the price remains below the resistance at 344.06 USD, you could try to take advantage of the bearish rally. The first bearish objective is located at 332.58 USD. The bearish momentum would be revived by a break in this support. Sellers would then use the next support located at 311.51 USD as an objective. Crossing it would then enable sellers to target 282.04 USD. Be careful, given the powerful bearish rally underway, excesses could lead to a short-term rebound. If this is the case, remember that trading against the trend may be riskier. It would seem more appropriate to wait for a signal indicating reversal of the trend.
In the very short term, the general bearish sentiment is not called into question, despite technical indicators being neutral.
FORCE
0
10
6.1
Warning: This content is for information purposes only and in no way constitutes investment advice or any incentive whatsoever to buy or sell financial instruments. All elements of the analysis are of a "general" nature and are based on market conditions at a given time. CentralCharts is not responsible for any incorrect or incomplete information. Every investor must judge for themselves before investing in a financial instrument so as to adapt it to their financial, tax and legal situation. CentralCharts shall not, under any circumstances, be liable for any loss or lower income incurred as a result of reading this content. Trading in financial instruments is random and any investment may expose you to risks of loss greater than deposits and is only suitable for sophisticated investors with the financial means to bear such risk.

This analysis was given by Vincent Launay. Take part yourself by sharing additional analysis on another time unit:
Additional analysis
Quotes
The ROPER TECHNOLOGIES INC. rating is 334.47 USD. The price registered an increase of +0.64% on the session and was traded between 330.57 USD and 335.18 USD over the period. The price is currently at +1.18% from its lowest and -0.21% from its highest.330.57
335.18
334.47
A bearish opening was detected by the Central Gaps scanner. Sellers are trying to impose a bearish trend in the very short term.
Bearish opening
Type : Bearish
Timeframe : Openning
Here is a more detailed summary of the historical variations registered by ROPER TECHNOLOGIES INC.:
Near a new LOW record (1 month)
Type : Bearish
Timeframe : Weekly
Technical
Technical analysis of this Daily chart of ROPER TECHNOLOGIES INC. indicates that the overall trend is strongly bearish. 92.86% of the signals given by moving averages are bearish. This strongly bearish trend is supported by the strong bearish signals given by short-term moving averages. There is no crossing of moving average by the price or crossing of moving averages between themselves.
In fact, Central Analyzer took into account 18 technical indicators and the result was as follows: 7 are bullish, 4 are neutral and 7 are bearish. But beware of excesses. The Central Indicators scanner currently detects this:
CCI indicator is oversold : under -100
Type : Neutral
Timeframe : Daily
Pivot points : price is under support 1
Type : Neutral
Timeframe : Weekly
The Central Patterns scanner, which studies chart patterns, resistances and supports, has identified this signal:
Horizontal resistance is broken
Type : Bullish
Timeframe : Daily
For a small setback in the very short term, the Central Candlesticks scanner currently notes the presence of this bearish pattern in Japanese candlesticks:
Dark cloud cover
Type : Bearish
Timeframe : Daily
ProTrendLines
S3
S2
S1
R1
R2
R3
Price
| S3 | S2 | S1 | Price | R1 | R2 | R3 | |
|---|---|---|---|---|---|---|---|
| ProTrendLines | 282.04 | 311.51 | 332.58 | 334.47 | 344.06 | 360.45 | 375.06 |
| Change (%) | -15.68% | -6.86% | -0.57% | - | +2.87% | +7.77% | +12.14% |
| Change | -52.43 | -22.96 | -1.89 | - | +9.59 | +25.98 | +40.59 |
| Level | Minor | Major | Major | - | Major | Intermediate | Minor |
Attention could also be paid to pivot points to set price objectives:
Daily
| Pivot points | S3 | S2 | S1 | PP | R1 | R2 | R3 |
|---|---|---|---|---|---|---|---|
| Standard | 306.35 | 314.28 | 323.30 | 331.23 | 340.25 | 348.18 | 357.20 |
| Camarilla | 327.67 | 329.22 | 330.78 | 332.33 | 333.88 | 335.44 | 336.99 |
| Woodie | 306.91 | 314.55 | 323.86 | 331.50 | 340.81 | 348.45 | 357.76 |
| Fibonacci | 314.28 | 320.75 | 324.75 | 331.23 | 337.70 | 341.70 | 348.18 |
Weekly
| Pivot points | S3 | S2 | S1 | PP | R1 | R2 | R3 |
|---|---|---|---|---|---|---|---|
| Standard | 327.31 | 331.32 | 334.62 | 338.62 | 341.92 | 345.93 | 349.23 |
| Camarilla | 335.91 | 336.58 | 337.25 | 337.92 | 338.59 | 339.26 | 339.93 |
| Woodie | 326.96 | 331.14 | 334.27 | 338.45 | 341.57 | 345.75 | 348.88 |
| Fibonacci | 331.32 | 334.11 | 335.83 | 338.62 | 341.41 | 343.14 | 345.93 |
Monthly
| Pivot points | S3 | S2 | S1 | PP | R1 | R2 | R3 |
|---|---|---|---|---|---|---|---|
| Standard | 298.45 | 318.23 | 337.17 | 356.95 | 375.88 | 395.66 | 414.60 |
| Camarilla | 345.46 | 349.01 | 352.56 | 356.10 | 359.65 | 363.20 | 366.75 |
| Woodie | 298.03 | 318.02 | 336.75 | 356.74 | 375.46 | 395.45 | 414.18 |
| Fibonacci | 318.23 | 333.02 | 342.16 | 356.95 | 371.74 | 380.87 | 395.66 |
Numerical data
The following are the details of the technical indicators and moving averages that were collected to generate this technical analysis:
Technical indicators
Moving averages
| RSI (14): | 41.02 | |
| MACD (12,26,9): | -4.9800 | |
| Directional Movement: | -19.44 | |
| AROON (14): | -64.29 | |
| DEMA (21): | 333.26 | |
| Parabolic SAR (0,02-0,02-0,2): | 347.42 | |
| Elder Ray (13): | -4.46 | |
| Super Trend (3,10): | 351.32 | |
| Zig ZAG (10): | 334.47 | |
| VORTEX (21): | 0.8200 | |
| Stochastique (14,3,5): | 35.26 | |
| TEMA (21): | 331.98 | |
| Williams %R (14): | -53.08 | |
| Chande Momentum Oscillator (20): | -3.93 | |
| Repulse (5,40,3): | 0.4400 | |
| ROCnROLL: | 2 | |
| TRIX (15,9): | -0.2100 | |
| Courbe Coppock: | 4.09 |
| MA7: | 335.74 | |
| MA20: | 338.95 | |
| MA50: | 350.72 | |
| MA100: | 358.17 | |
| MAexp7: | 335.24 | |
| MAexp20: | 339.92 | |
| MAexp50: | 347.53 | |
| MAexp100: | 349.55 | |
| Price / MA7: | -0.38% | |
| Price / MA20: | -1.32% | |
| Price / MA50: | -4.63% | |
| Price / MA100: | -6.62% | |
| Price / MAexp7: | -0.23% | |
| Price / MAexp20: | -1.60% | |
| Price / MAexp50: | -3.76% | |
| Price / MAexp100: | -4.31% |
News
The latest news and videos published on ROPER TECHNOLOGIES INC. at the time of the analysis were as follows:
- DAT: Fewer trucks meant higher rates in September
- AMETEK to Acquire Gatan from Roper Technologies
- Freight Recession? August Truckload Volumes Suggest Otherwise
- DAT: Truckload Spot Rates Slip Seasonally, But Uncertainty Looms
- DAT: Truckload Rates Heat Up in June, as Spot Market Volumes Beat 2018 Levels
This member declared not having a position on this financial instrument or a related financial instrument.
About author

Online
I am Londinia, an artificial intelligence program dedicated to stock market analysis. I am able to analyse and interpret graphical and market data. Learn more…


Add a comment
Comments
0 comments on the analysis ROPER TECHNOLOGIES INC. - Daily