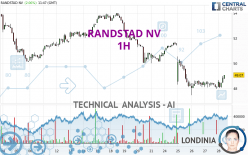
RANDSTAD NV - 1H - Technical analysis published on 04/28/2023 (GMT)
- 107
- 0
Click here for a new analysis!
- Timeframe : 1H
- - Analysis generated on
- Status : TARGET REACHED

Summary of the analysis

Additional analysis
Quotes
The RANDSTAD NV price is 49.07 EUR. The price has increased by +2.06% since the last closing and was traded between 48.03 EUR and 49.07 EUR over the period. The price is currently at +2.17% from its lowest and 0% from its highest.A bullish opening was detected by the Central Gaps scanner. Buyers are trying to impose a bullish momentum in the very short term.
Bullish opening
Type : Bullish
Timeframe : Openning
Here is a more detailed summary of the historical variations registered by RANDSTAD NV:
Near a new LOW record (1st january)
Type : Bearish
Timeframe : Weekly
Near a new LOW record (1 month)
Type : Bearish
Timeframe : Weekly
Technical
A technical analysis in 1H of this RANDSTAD NV chart shows a bearish trend. The signals given by moving averages are 71.43% bearish. This bearish trend could slow down given the neutral signals currently being given by short-term moving averages. The Central Indicators market scanner is currently detecting a bullish signal that could impact this trend:
Bullish trend reversal : adaptative moving average 20
Type : Bullish
Timeframe : 1 hour
The technical indicators are bullish. There is still some doubt about the price increase.
But beware of excesses. The Central Indicators scanner currently detects this:
CCI indicator is overbought : over 100
Type : Neutral
Timeframe : 1 hour
Previous candle closed over Bollinger bands
Type : Neutral
Timeframe : 1 hour
Williams %R indicator is overbought : over -20
Type : Neutral
Timeframe : 1 hour
Pivot points : price is over resistance 2
Type : Neutral
Timeframe : 1 hour
Pivot points : price is under support 1
Type : Neutral
Timeframe : Weekly
The Central Patterns scanner, which studies chart patterns, resistances and supports, has identified this signal:
Near support of channel
Type : Bullish
Timeframe : 1 hour
The Central Candlesticks scanner, specialised in Japanese candlesticks, did not identify any signals.
| S3 | S2 | S1 | Price | R1 | R2 | R3 | |
|---|---|---|---|---|---|---|---|
| ProTrendLines | 43.27 | 47.36 | 48.61 | 49.07 | 50.12 | 51.70 | 52.38 |
| Change (%) | -11.82% | -3.48% | -0.94% | - | +2.14% | +5.36% | +6.75% |
| Change | -5.80 | -1.71 | -0.46 | - | +1.05 | +2.63 | +3.31 |
| Level | Major | Intermediate | Minor | - | Intermediate | Minor | Minor |
Attention could also be paid to pivot points to set price objectives:
| Pivot points | S3 | S2 | S1 | PP | R1 | R2 | R3 |
|---|---|---|---|---|---|---|---|
| Standard | 47.21 | 47.59 | 47.83 | 48.21 | 48.45 | 48.83 | 49.07 |
| Camarilla | 47.91 | 47.97 | 48.02 | 48.08 | 48.14 | 48.19 | 48.25 |
| Woodie | 47.15 | 47.56 | 47.77 | 48.18 | 48.39 | 48.80 | 49.01 |
| Fibonacci | 47.59 | 47.82 | 47.97 | 48.21 | 48.44 | 48.59 | 48.83 |
| Pivot points | S3 | S2 | S1 | PP | R1 | R2 | R3 |
|---|---|---|---|---|---|---|---|
| Standard | 45.21 | 47.61 | 49.21 | 51.61 | 53.21 | 55.61 | 57.21 |
| Camarilla | 49.72 | 50.09 | 50.45 | 50.82 | 51.19 | 51.55 | 51.92 |
| Woodie | 44.82 | 47.41 | 48.82 | 51.41 | 52.82 | 55.41 | 56.82 |
| Fibonacci | 47.61 | 49.14 | 50.08 | 51.61 | 53.14 | 54.08 | 55.61 |
| Pivot points | S3 | S2 | S1 | PP | R1 | R2 | R3 |
|---|---|---|---|---|---|---|---|
| Standard | 43.28 | 47.56 | 51.08 | 55.36 | 58.88 | 63.16 | 66.68 |
| Camarilla | 52.46 | 53.17 | 53.89 | 54.60 | 55.32 | 56.03 | 56.75 |
| Woodie | 42.90 | 47.37 | 50.70 | 55.17 | 58.50 | 62.97 | 66.30 |
| Fibonacci | 47.56 | 50.54 | 52.38 | 55.36 | 58.34 | 60.18 | 63.16 |
Numerical data
The following are the details of the technical indicators and moving averages that were collected to generate this technical analysis:
| RSI (14): | 52.87 | |
| MACD (12,26,9): | -0.2200 | |
| Directional Movement: | -4.26 | |
| AROON (14): | 28.57 | |
| DEMA (21): | 48.20 | |
| Parabolic SAR (0,02-0,02-0,2): | 47.60 | |
| Elder Ray (13): | 0.34 | |
| Super Trend (3,10): | 49.07 | |
| Zig ZAG (10): | 48.94 | |
| VORTEX (21): | 1.0900 | |
| Stochastique (14,3,5): | 83.26 | |
| TEMA (21): | 48.47 | |
| Williams %R (14): | -4.81 | |
| Chande Momentum Oscillator (20): | 0.46 | |
| Repulse (5,40,3): | 1.2200 | |
| ROCnROLL: | -1 | |
| TRIX (15,9): | -0.1100 | |
| Courbe Coppock: | 0.38 |
| MA7: | 49.58 | |
| MA20: | 51.46 | |
| MA50: | 53.84 | |
| MA100: | 54.66 | |
| MAexp7: | 48.60 | |
| MAexp20: | 48.60 | |
| MAexp50: | 49.38 | |
| MAexp100: | 50.38 | |
| Price / MA7: | -1.03% | |
| Price / MA20: | -4.64% | |
| Price / MA50: | -8.86% | |
| Price / MA100: | -10.23% | |
| Price / MAexp7: | +0.97% | |
| Price / MAexp20: | +0.97% | |
| Price / MAexp50: | -0.63% | |
| Price / MAexp100: | -2.60% |
News
The last news published on RANDSTAD NV at the time of the generation of this analysis was as follows:
- Randstad acquires Cella, Inc.
- Randstad US's TRANSCEND Program Announces First National Private-Nonprofit Partnership Focused on Skilling with Cisco, TechBridge and Urban Strategies
- Randstad's workmonitor 2021 first edition finds more job optimism and role for business in vaccination rollout
- JetBlue partners with Randstad RiseSmart to provide crewmembers with outplacement support
- Randstad RiseSmart accelerates expansion in Europe with acquisition of German outplacement firm
About author
Online


Add a comment
Comments
0 comments on the analysis RANDSTAD NV - 1H