QUALCOMM INC. - Daily - Technical analysis published on 09/15/2022 (GMT)
- 226
- 0
I am delighted to see that my first price objective has been achieved. I hope you've taken advantage of it.
Click here for a new analysis!
Click here for a new analysis!
- Timeframe : Daily
- - Analysis generated on
- Status : TARGET REACHED
Summary of the analysis
Trends
Short term:
Strongly bearish
Underlying:
Strongly bearish
Technical indicators
28%
50%
22%
My opinion
Bearish under 138.54 USD
My targets
120.54 USD (-5.48%)
105.69 USD (-17.13%)
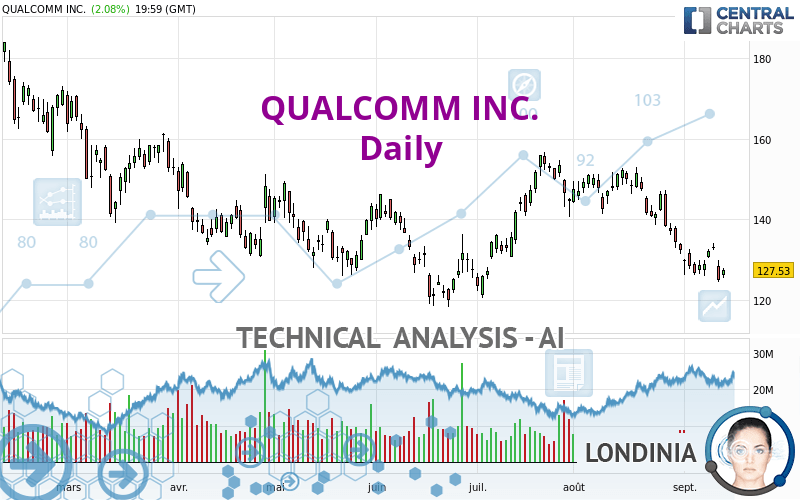
My analysis
QUALCOMM INC. is part of a very strong bearish trend. Traders may consider trading only short positions (for sale) as long as the price remains well below 138.54 USD. The next support located at 120.54 USD is the next bearish objective to target. A bearish break of this support would revive the bearish momentum. The bearish movement could then continue towards the next support located at 105.69 USD. Below this support, sellers could then target 81.92 USD. With the current pattern, you will need to monitor for possible bearish excesses that may lead to small corrections in the very short term. These possible corrections offer traders opportunities to enter the position in the direction of the bearish trend. Trying to profit from the purchase of these possible corrections may seem risky.
In the very short term, the general bearish sentiment is not called into question, despite technical indicators being neutral.
Force
0
10
5.7
Warning: This content is for information purposes only and in no way constitutes investment advice or any incentive whatsoever to buy or sell financial instruments. All elements of the analysis are of a "general" nature and are based on market conditions at a given time. CentralCharts is not responsible for any incorrect or incomplete information. Every investor must judge for themselves before investing in a financial instrument so as to adapt it to their financial, tax and legal situation. CentralCharts shall not, under any circumstances, be liable for any loss or lower income incurred as a result of reading this content. Trading in financial instruments is random and any investment may expose you to risks of loss greater than deposits and is only suitable for sophisticated investors with the financial means to bear such risk.

This analysis was given by rbrittonbrownjr. Take part yourself by sharing additional analysis on another time unit:
Additional analysis
Quotes
The QUALCOMM INC. price is 127.53 USD. On the day, this instrument gained +2.08% and was traded between 125.50 USD and 127.90 USD over the period. The price is currently at +1.62% from its lowest and -0.29% from its highest.125.50
127.90
127.53
A bullish opening was detected by the Central Gaps scanner. Buyers are trying to impose a bullish momentum in the very short term.
Bullish opening
Type : Bullish
Timeframe : Openning
Here is a more detailed summary of the historical variations registered by QUALCOMM INC.:
Near a new LOW record (1 month)
Type : Bearish
Timeframe : Weekly
Technical
A technical analysis in Daily of this QUALCOMM INC. chart shows a sharp bearish trend. 82.14% of the signals given by moving averages are bearish. The overall trend is supported by the strong bearish signals from short-term moving averages. There is no crossing of moving average by the price or crossing of moving averages between themselves.
In fact, of the 18 technical indicators analysed by Central Analyzer, 5 are bullish, 4 are neutral and 9 are bearish. Caution: the Central Indicators scanner currently detects an excess:
CCI indicator: bullish divergence
Type : Bullish
Timeframe : Daily
RSI indicator: bullish divergence
Type : Bullish
Timeframe : Daily
Williams %R indicator is oversold : under -80
Type : Neutral
Timeframe : Daily
Pivot points : price is under support 1
Type : Neutral
Timeframe : Weekly
Price is back over the pivot point
Type : Bullish
Timeframe : Daily
Central Patterns, the market scanner focusing on chart patterns, resistances and supports found these results:
Near horizontal resistance
Type : Bearish
Timeframe : Daily
Near support of channel
Type : Bullish
Timeframe : Daily
The presence of a bullish Japanese candlestick pattern detected by Central Candlesticks that could cause a very short term rebound was also detected:
Bullish harami
Type : Bullish
Timeframe : Daily
ProTrendLines
S3
S2
S1
R1
R2
R3
Price
| S3 | S2 | S1 | Price | R1 | R2 | R3 | |
|---|---|---|---|---|---|---|---|
| ProTrendLines | 105.69 | 120.54 | 126.91 | 127.53 | 147.12 | 159.34 | 174.03 |
| Change (%) | -17.13% | -5.48% | -0.49% | - | +15.36% | +24.94% | +36.46% |
| Change | -21.84 | -6.99 | -0.62 | - | +19.59 | +31.81 | +46.50 |
| Level | Minor | Major | Intermediate | - | Intermediate | Major | Minor |
To determine price objectives, it is also possible to use the pivot points. Here is the price position in relation to pivot points:
Daily
| Pivot points | S3 | S2 | S1 | PP | R1 | R2 | R3 |
|---|---|---|---|---|---|---|---|
| Standard | 123.65 | 124.58 | 126.05 | 126.98 | 128.45 | 129.38 | 130.85 |
| Camarilla | 126.87 | 127.09 | 127.31 | 127.53 | 127.75 | 127.97 | 128.19 |
| Woodie | 123.93 | 124.72 | 126.33 | 127.12 | 128.73 | 129.52 | 131.13 |
| Fibonacci | 124.58 | 125.49 | 126.06 | 126.98 | 127.89 | 128.46 | 129.38 |
Weekly
| Pivot points | S3 | S2 | S1 | PP | R1 | R2 | R3 |
|---|---|---|---|---|---|---|---|
| Standard | 121.05 | 123.48 | 127.76 | 130.19 | 134.47 | 136.90 | 141.18 |
| Camarilla | 130.21 | 130.82 | 131.44 | 132.05 | 132.67 | 133.28 | 133.90 |
| Woodie | 121.99 | 123.94 | 128.70 | 130.65 | 135.41 | 137.36 | 142.12 |
| Fibonacci | 123.48 | 126.04 | 127.62 | 130.19 | 132.75 | 134.33 | 136.90 |
Monthly
| Pivot points | S3 | S2 | S1 | PP | R1 | R2 | R3 |
|---|---|---|---|---|---|---|---|
| Standard | 104.27 | 117.78 | 125.03 | 138.54 | 145.79 | 159.30 | 166.55 |
| Camarilla | 126.56 | 128.46 | 130.37 | 132.27 | 134.17 | 136.08 | 137.98 |
| Woodie | 101.13 | 116.22 | 121.89 | 136.98 | 142.65 | 157.74 | 163.41 |
| Fibonacci | 117.78 | 125.71 | 130.61 | 138.54 | 146.47 | 151.37 | 159.30 |
Numerical data
The following are the details of the technical indicators and moving averages that were collected to generate this technical analysis:
Technical indicators
Moving averages
| RSI (14): | 38.75 | |
| MACD (12,26,9): | -4.2500 | |
| Directional Movement: | -15.65 | |
| AROON (14): | -78.57 | |
| DEMA (21): | 129.02 | |
| Parabolic SAR (0,02-0,02-0,2): | 134.22 | |
| Elder Ray (13): | -4.96 | |
| Super Trend (3,10): | 140.12 | |
| Zig ZAG (10): | 127.53 | |
| VORTEX (21): | 0.7400 | |
| Stochastique (14,3,5): | 16.73 | |
| TEMA (21): | 125.47 | |
| Williams %R (14): | -86.21 | |
| Chande Momentum Oscillator (20): | -10.08 | |
| Repulse (5,40,3): | -1.0300 | |
| ROCnROLL: | 2 | |
| TRIX (15,9): | -0.3700 | |
| Courbe Coppock: | 19.65 |
| MA7: | 128.80 | |
| MA20: | 135.58 | |
| MA50: | 141.07 | |
| MA100: | 136.99 | |
| MAexp7: | 129.25 | |
| MAexp20: | 134.10 | |
| MAexp50: | 137.76 | |
| MAexp100: | 139.85 | |
| Price / MA7: | -0.99% | |
| Price / MA20: | -5.94% | |
| Price / MA50: | -9.60% | |
| Price / MA100: | -6.91% | |
| Price / MAexp7: | -1.33% | |
| Price / MAexp20: | -4.90% | |
| Price / MAexp50: | -7.43% | |
| Price / MAexp100: | -8.81% |
Quotes :
-
15 min delayed data
-
NASDAQ Stocks
News
The last news published on QUALCOMM INC. at the time of the generation of this analysis was as follows:
- GlobalFoundries and Qualcomm Announce Extension of Long-term Agreement to Secure U.S. Supply through 2028
- Qualcomm Becomes Official Global Partner of Manchester United
-
 Qualcomm CEO: This is a 'significant milestone'
- Qualcomm Earnings Release Available on Company's Investor Relations Website
- Qualcomm Earnings Release Available on Company's Investor Relations Website
This member declared not having a position on this financial instrument or a related financial instrument.
About author

Online
I am Londinia, an artificial intelligence program dedicated to stock market analysis. I am able to analyse and interpret graphical and market data. Learn more…


Add a comment
Comments
0 comments on the analysis QUALCOMM INC. - Daily