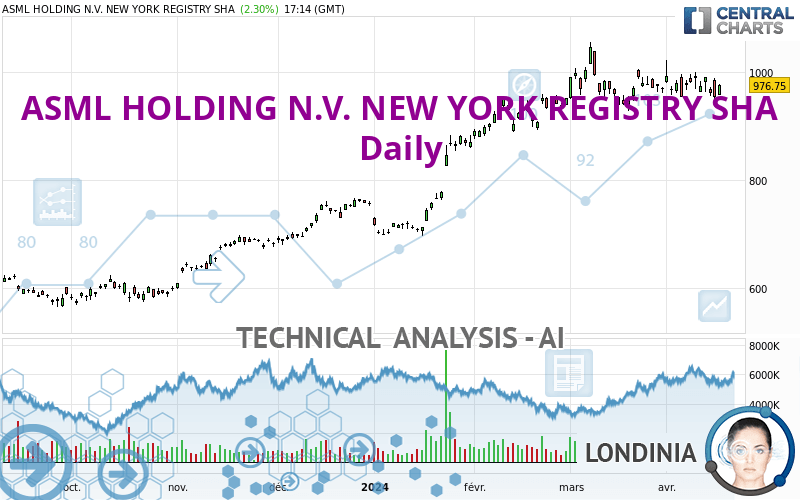
ASML HOLDING N.V. NEW YORK REGISTRY SHA - Daily - Technical analysis published on 04/16/2024 (GMT)
- 67
- 0
Click here for a new analysis!
- Timeframe : Daily
- - Analysis generated on
- Status : INVALID

Summary of the analysis

Additional analysis
Quotes
The ASML HOLDING N.V. NEW YORK REGISTRY SHA rating is 976.75 USD. On the day, this instrument gained +2.30% with the lowest point at 957.20 USD and the highest point at 978.08 USD. The deviation from the price is +2.04% for the low point and -0.14% for the high point.A study of price movements over other periods shows the following variations:
Near a new HIGH record (1 month)
Type : Bullish
Timeframe : Weekly
Technical
A technical analysis in Daily of this ASML HOLDING N.V. NEW YORK REGISTRY SHA chart shows a strongly bullish trend. 92.86% of the signals given by moving averages are bullish. The overall trend is supported by the strong bullish signals from short-term moving averages. The Central Indicators scanner detects bullish signals on moving averages that could impact this trend:
Bullish price crossover with Moving Average 20
Type : Bullish
Timeframe : Daily
Bullish price crossover with Moving Average 50
Type : Bullish
Timeframe : Daily
Bullish price crossover with adaptative moving average 20
Type : Bullish
Timeframe : Daily
Bullish price crossover with adaptative moving average 50
Type : Bullish
Timeframe : Daily
Bullish price crossover with adaptative moving average 100
Type : Bullish
Timeframe : Daily
An assessment of technical indicators does not currently provide any relevant information on the direction of future price movements.
Central Indicators, the detector scanner for these technical indicators has recently detected several signals:
RSI indicator is back over 50
Type : Bullish
Timeframe : Daily
Ichimoku - Bullish crossover : Tenkan & Kijun
Type : Bullish
Timeframe : Daily
Price is back over the pivot point
Type : Bullish
Timeframe : Daily
Momentum indicator is back over 0
Type : Bullish
Timeframe : Daily
An analysis of the price chart with the Central Patterns scanner (detector of chart patterns and resistances and supports) shows several results that can have an impact on the price change:
Near support of channel
Type : Bullish
Timeframe : Daily
Near support of triangle
Type : Bullish
Timeframe : Daily
The presence of a bullish Japanese candlestick pattern detected by Central Candlesticks that could cause a very short term rebound was also detected:
Bullish harami
Type : Bullish
Timeframe : Daily
| S3 | S2 | S1 | Price | R1 | R2 | |
|---|---|---|---|---|---|---|
| ProTrendLines | 754.99 | 871.92 | 940.21 | 976.75 | 992.52 | 1,047.39 |
| Change (%) | -22.70% | -10.73% | -3.74% | - | +1.61% | +7.23% |
| Change | -221.76 | -104.83 | -36.54 | - | +15.77 | +70.64 |
| Level | Minor | Major | Intermediate | - | Intermediate | Major |
Attention could also be paid to pivot points to set price objectives:
| Pivot points | S3 | S2 | S1 | PP | R1 | R2 | R3 |
|---|---|---|---|---|---|---|---|
| Standard | 903.42 | 927.26 | 941.04 | 964.88 | 978.66 | 1,002.50 | 1,016.28 |
| Camarilla | 944.48 | 947.92 | 951.37 | 954.82 | 958.27 | 961.72 | 965.17 |
| Woodie | 898.39 | 924.75 | 936.01 | 962.37 | 973.63 | 999.99 | 1,011.25 |
| Fibonacci | 927.26 | 941.63 | 950.51 | 964.88 | 979.25 | 988.13 | 1,002.50 |
| Pivot points | S3 | S2 | S1 | PP | R1 | R2 | R3 |
|---|---|---|---|---|---|---|---|
| Standard | 901.78 | 929.13 | 945.49 | 972.84 | 989.20 | 1,016.55 | 1,032.91 |
| Camarilla | 949.82 | 953.83 | 957.83 | 961.84 | 965.85 | 969.85 | 973.86 |
| Woodie | 896.28 | 926.38 | 939.99 | 970.09 | 983.70 | 1,013.80 | 1,027.41 |
| Fibonacci | 929.13 | 945.83 | 956.15 | 972.84 | 989.54 | 999.86 | 1,016.55 |
| Pivot points | S3 | S2 | S1 | PP | R1 | R2 | R3 |
|---|---|---|---|---|---|---|---|
| Standard | 785.19 | 856.60 | 913.53 | 984.94 | 1,041.87 | 1,113.28 | 1,170.21 |
| Camarilla | 935.18 | 946.94 | 958.71 | 970.47 | 982.24 | 994.00 | 1,005.76 |
| Woodie | 777.96 | 852.98 | 906.30 | 981.32 | 1,034.64 | 1,109.66 | 1,162.98 |
| Fibonacci | 856.60 | 905.62 | 935.91 | 984.94 | 1,033.96 | 1,064.25 | 1,113.28 |
Numerical data
The following are the details of the technical indicators and moving averages that were collected to generate this technical analysis:
| RSI (14): | 51.84 | |
| MACD (12,26,9): | 5.2400 | |
| Directional Movement: | 9.02 | |
| AROON (14): | -71.43 | |
| DEMA (21): | 981.12 | |
| Parabolic SAR (0,02-0,02-0,2): | 946.86 | |
| Elder Ray (13): | -5.63 | |
| Super Trend (3,10): | 1,029.43 | |
| Zig ZAG (10): | 975.32 | |
| VORTEX (21): | 0.9100 | |
| Stochastique (14,3,5): | 17.25 | |
| TEMA (21): | 969.06 | |
| Williams %R (14): | -65.64 | |
| Chande Momentum Oscillator (20): | 5.22 | |
| Repulse (5,40,3): | -0.1600 | |
| ROCnROLL: | 1 | |
| TRIX (15,9): | 0.1100 | |
| Courbe Coppock: | 0.07 |
| MA7: | 976.22 | |
| MA20: | 974.64 | |
| MA50: | 959.00 | |
| MA100: | 852.12 | |
| MAexp7: | 972.68 | |
| MAexp20: | 971.60 | |
| MAexp50: | 938.94 | |
| MAexp100: | 872.58 | |
| Price / MA7: | +0.05% | |
| Price / MA20: | +0.22% | |
| Price / MA50: | +1.85% | |
| Price / MA100: | +14.63% | |
| Price / MAexp7: | +0.42% | |
| Price / MAexp20: | +0.53% | |
| Price / MAexp50: | +4.03% | |
| Price / MAexp100: | +11.94% |
About author
Online


Add a comment
Comments
0 comments on the analysis ASML HOLDING N.V. NEW YORK REGISTRY SHA - Daily