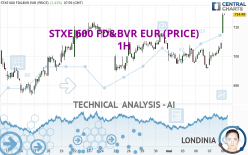
STXE 600 FD&BVR EUR (PRICE) - 1H - Technical analysis published on 05/08/2024 (GMT)
- 83
- 0
Click here for a new analysis!
- Timeframe : 1H
- - Analysis generated on
- Status : TARGET REACHED

Summary of the analysis

Additional analysis
Quotes
STXE 600 FD&BVR EUR (PRICE) rating 714.19 EUR. The price has increased by +1.37% since the last closing with the lowest point at 708.01 EUR and the highest point at 714.82 EUR. The deviation from the price is +0.87% for the low point and -0.09% for the high point.The Central Gaps scanner detects the formation of a bullish gap marking the strong presence of buyers against sellers at the opening. This formed a quotation gap.
Opening Gap UP
Type : Bullish
Timeframe : Openning
A study of price movements over other periods shows the following variations:
Near a new LOW record (1 year)
Type : Bearish
Timeframe : Weekly
Near a new HIGH record (1st january)
Type : Bullish
Timeframe : Weekly
New HIGH record (1 month)
Type : Bullish
Timeframe : Weekly
Technical
A technical analysis in 1H of this STXE 600 FD&BVR EUR (PRICE) chart shows a bullish trend. The signals returned by the moving averages are 78.57% bullish. This bullish trend is reinforced by the strong signals currently being given by short-term moving averages. The Central Indicators market scanner is currently detecting a bullish signal that could impact this trend:
Bullish trend reversal : Moving Average 50
Type : Bullish
Timeframe : 1 hour
In fact, according to the parameters integrated into the Central Analyzer system, 17 technical indicators out of 18 analysed are currently bullish. But beware of excesses. The Central Indicators scanner currently detects this:
RSI indicator is overbought : over 70
Type : Neutral
Timeframe : 1 hour
CCI indicator is overbought : over 100
Type : Neutral
Timeframe : 1 hour
Williams %R indicator is overbought : over -20
Type : Neutral
Timeframe : 1 hour
Pivot points : price is over resistance 2
Type : Neutral
Timeframe : 1 hour
Pivot points : price is over resistance 2
Type : Neutral
Timeframe : Weekly
The analysis of the price chart with Central Patterns scanners does not return any result.
The presence of these bullish Japanese candlestick patterns detected by Central Candlesticks that could cause a very short term rebound were also noted:
White line without lower shadow
Type : Bullish
Timeframe : 1 hour
Upside gap
Type : Bullish
Timeframe : 1 hour
White marubozu
Type : Bullish
Timeframe : 1 hour
| S3 | S2 | S1 | Price | R1 | R2 | R3 | |
|---|---|---|---|---|---|---|---|
| ProTrendLines | 702.94 | 708.04 | 711.84 | 714.19 | 719.69 | 739.17 | 756.64 |
| Change (%) | -1.58% | -0.86% | -0.33% | - | +0.77% | +3.50% | +5.94% |
| Change | -11.25 | -6.15 | -2.35 | - | +5.50 | +24.98 | +42.45 |
| Level | Major | Minor | Intermediate | - | Intermediate | Major | Minor |
Attention could also be paid to pivot points to set price objectives:
| Pivot points | S3 | S2 | S1 | PP | R1 | R2 | R3 |
|---|---|---|---|---|---|---|---|
| Standard | 692.02 | 694.53 | 699.55 | 702.06 | 707.08 | 709.59 | 714.61 |
| Camarilla | 702.50 | 703.19 | 703.88 | 704.57 | 705.26 | 705.95 | 706.64 |
| Woodie | 693.28 | 695.16 | 700.81 | 702.69 | 708.34 | 710.22 | 715.87 |
| Fibonacci | 694.53 | 697.41 | 699.18 | 702.06 | 704.94 | 706.71 | 709.59 |
| Pivot points | S3 | S2 | S1 | PP | R1 | R2 | R3 |
|---|---|---|---|---|---|---|---|
| Standard | 683.50 | 690.46 | 694.12 | 701.08 | 704.74 | 711.70 | 715.36 |
| Camarilla | 694.86 | 695.83 | 696.81 | 697.78 | 698.75 | 699.73 | 700.70 |
| Woodie | 681.85 | 689.64 | 692.47 | 700.26 | 703.09 | 710.88 | 713.71 |
| Fibonacci | 690.46 | 694.52 | 697.02 | 701.08 | 705.14 | 707.64 | 711.70 |
| Pivot points | S3 | S2 | S1 | PP | R1 | R2 | R3 |
|---|---|---|---|---|---|---|---|
| Standard | 655.02 | 670.84 | 686.71 | 702.53 | 718.40 | 734.22 | 750.09 |
| Camarilla | 693.88 | 696.78 | 699.69 | 702.59 | 705.50 | 708.40 | 711.31 |
| Woodie | 655.06 | 670.85 | 686.75 | 702.54 | 718.44 | 734.23 | 750.13 |
| Fibonacci | 670.84 | 682.94 | 690.42 | 702.53 | 714.63 | 722.11 | 734.22 |
Numerical data
The following is the status of the technical indicators and moving averages at the time of publication of this technical analysis:
| RSI (14): | 78.83 | |
| MACD (12,26,9): | 1.4700 | |
| Directional Movement: | 42.69 | |
| AROON (14): | 71.43 | |
| DEMA (21): | 703.48 | |
| Parabolic SAR (0,02-0,02-0,2): | 696.97 | |
| Elder Ray (13): | 8.27 | |
| Super Trend (3,10): | 703.32 | |
| Zig ZAG (10): | 714.06 | |
| VORTEX (21): | 1.0500 | |
| Stochastique (14,3,5): | 95.87 | |
| TEMA (21): | 705.30 | |
| Williams %R (14): | -0.85 | |
| Chande Momentum Oscillator (20): | 17.27 | |
| Repulse (5,40,3): | 1.5200 | |
| ROCnROLL: | 1 | |
| TRIX (15,9): | 0.0000 | |
| Courbe Coppock: | 1.22 |
| MA7: | 702.45 | |
| MA20: | 700.51 | |
| MA50: | 705.58 | |
| MA100: | 714.28 | |
| MAexp7: | 705.12 | |
| MAexp20: | 702.07 | |
| MAexp50: | 701.55 | |
| MAexp100: | 701.70 | |
| Price / MA7: | +1.67% | |
| Price / MA20: | +1.95% | |
| Price / MA50: | +1.22% | |
| Price / MA100: | -0.01% | |
| Price / MAexp7: | +1.29% | |
| Price / MAexp20: | +1.73% | |
| Price / MAexp50: | +1.80% | |
| Price / MAexp100: | +1.78% |
About author
Online


Add a comment
Comments
0 comments on the analysis STXE 600 FD&BVR EUR (PRICE) - 1H