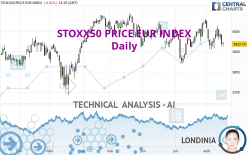
STOXX50 PRICE EUR INDEX - Daily - Technical analysis published on 08/16/2023 (GMT)
- 151
- 0
Click here for a new analysis!
- Timeframe : Daily
- - Analysis generated on
- Status : TARGET REACHED

Summary of the analysis

Additional analysis
Quotes
The STOXX50 PRICE EUR INDEX rating is 3,937.58 EUR. The price registered a decrease of -0.01% on the session with the lowest point at 3,925.28 EUR and the highest point at 3,949.47 EUR. The deviation from the price is +0.31% for the low point and -0.30% for the high point.A bullish opening was detected by the Central Gaps scanner. Buyers are trying to impose a bullish momentum in the very short term.
Bullish opening
Type : Bullish
Timeframe : Openning
So that you have an overall view of the price change, here is a table showing the variations over several periods:
Near a new HIGH record (5 years)
Type : Bullish
Timeframe : Weekly
Near a new HIGH record (1 year)
Type : Bullish
Timeframe : Weekly
Near a new HIGH record (1st january)
Type : Bullish
Timeframe : Weekly
Near a new HIGH record (1 month)
Type : Bullish
Timeframe : Weekly
Technical
A technical analysis in Daily of this STOXX50 PRICE EUR INDEX chart shows a bearish trend. 71.43% of the signals given by moving averages are bearish. This bearish trend is supported by the strong bearish signals given by short-term moving averages. The Central Indicators scanner detects bearish signals on moving averages that could impact this trend:
Bearish trend reversal : Moving Average 20
Type : Bearish
Timeframe : Daily
Bearish trend reversal : adaptative moving average 50
Type : Bearish
Timeframe : Daily
Bearish trend reversal : adaptative moving average 100
Type : Bearish
Timeframe : Daily
In fact, of the 18 technical indicators analysed by Central Analyzer, 4 are bullish, 5 are neutral and 9 are bearish. Caution: the Central Indicators scanner currently detects an excess:
CCI indicator is oversold : under -100
Type : Neutral
Timeframe : Daily
Williams %R indicator is oversold : under -80
Type : Neutral
Timeframe : Daily
Ichimoku - Bearish crossover : Tenkan & Kijun
Type : Bearish
Timeframe : Daily
Price is back under the pivot point
Type : Bearish
Timeframe : Weekly
No signals are given by Central Patterns, a market scanner specialised in chart patterns, resistances and supports.
The Central Candlesticks scanner, specialised in Japanese candlesticks, did not identify any signals.
| S3 | S2 | S1 | Price | R1 | R2 | |
|---|---|---|---|---|---|---|
| ProTrendLines | 3,731.99 | 3,866.60 | 3,925.25 | 3,937.58 | 4,000.72 | 4,078.75 |
| Change (%) | -5.22% | -1.80% | -0.31% | - | +1.60% | +3.59% |
| Change | -205.59 | -70.98 | -12.33 | - | +63.14 | +141.17 |
| Level | Minor | Major | Major | - | Minor | Major |
Attention could also be paid to pivot points to set price objectives:
| Pivot points | S3 | S2 | S1 | PP | R1 | R2 | R3 |
|---|---|---|---|---|---|---|---|
| Standard | 3,856.98 | 3,891.92 | 3,915.00 | 3,949.94 | 3,973.02 | 4,007.96 | 4,031.04 |
| Camarilla | 3,922.12 | 3,927.43 | 3,932.75 | 3,938.07 | 3,943.39 | 3,948.71 | 3,954.03 |
| Woodie | 3,851.04 | 3,888.96 | 3,909.06 | 3,946.98 | 3,967.08 | 4,005.00 | 4,025.10 |
| Fibonacci | 3,891.92 | 3,914.09 | 3,927.78 | 3,949.94 | 3,972.11 | 3,985.80 | 4,007.96 |
| Pivot points | S3 | S2 | S1 | PP | R1 | R2 | R3 |
|---|---|---|---|---|---|---|---|
| Standard | 3,809.42 | 3,863.62 | 3,918.56 | 3,972.76 | 4,027.70 | 4,081.90 | 4,136.84 |
| Camarilla | 3,943.50 | 3,953.50 | 3,963.51 | 3,973.51 | 3,983.52 | 3,993.52 | 4,003.52 |
| Woodie | 3,809.80 | 3,863.81 | 3,918.94 | 3,972.95 | 4,028.08 | 4,082.09 | 4,137.22 |
| Fibonacci | 3,863.62 | 3,905.31 | 3,931.07 | 3,972.76 | 4,014.45 | 4,040.21 | 4,081.90 |
| Pivot points | S3 | S2 | S1 | PP | R1 | R2 | R3 |
|---|---|---|---|---|---|---|---|
| Standard | 3,695.19 | 3,769.76 | 3,911.64 | 3,986.21 | 4,128.09 | 4,202.66 | 4,344.54 |
| Camarilla | 3,994.01 | 4,013.85 | 4,033.69 | 4,053.53 | 4,073.37 | 4,093.21 | 4,113.05 |
| Woodie | 3,728.86 | 3,786.59 | 3,945.31 | 4,003.04 | 4,161.76 | 4,219.49 | 4,378.21 |
| Fibonacci | 3,769.76 | 3,852.44 | 3,903.52 | 3,986.21 | 4,068.89 | 4,119.97 | 4,202.66 |
Numerical data
The following are the details of the technical indicators and moving averages that were collected to generate this technical analysis:
| RSI (14): | 44.15 | |
| MACD (12,26,9): | -3.0100 | |
| Directional Movement: | -7.57 | |
| AROON (14): | -28.57 | |
| DEMA (21): | 3,968.14 | |
| Parabolic SAR (0,02-0,02-0,2): | 3,916.60 | |
| Elder Ray (13): | -30.68 | |
| Super Trend (3,10): | 4,050.52 | |
| Zig ZAG (10): | 3,937.00 | |
| VORTEX (21): | 1.0000 | |
| Stochastique (14,3,5): | 29.33 | |
| TEMA (21): | 3,965.62 | |
| Williams %R (14): | -80.00 | |
| Chande Momentum Oscillator (20): | -115.42 | |
| Repulse (5,40,3): | -0.7400 | |
| ROCnROLL: | 2 | |
| TRIX (15,9): | 0.0100 | |
| Courbe Coppock: | 2.02 |
| MA7: | 3,970.30 | |
| MA20: | 3,983.47 | |
| MA50: | 3,967.42 | |
| MA100: | 3,986.25 | |
| MAexp7: | 3,961.47 | |
| MAexp20: | 3,969.76 | |
| MAexp50: | 3,970.82 | |
| MAexp100: | 3,950.75 | |
| Price / MA7: | -0.82% | |
| Price / MA20: | -1.15% | |
| Price / MA50: | -0.75% | |
| Price / MA100: | -1.22% | |
| Price / MAexp7: | -0.60% | |
| Price / MAexp20: | -0.81% | |
| Price / MAexp50: | -0.84% | |
| Price / MAexp100: | -0.33% |
About author
Online


Add a comment
Comments
0 comments on the analysis STOXX50 PRICE EUR INDEX - Daily