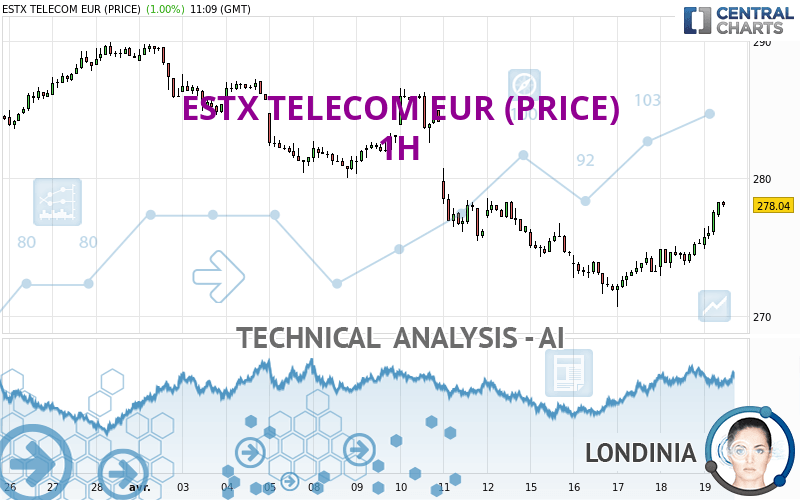
ESTX TELECOM EUR (PRICE) - 1H - Technical analysis published on 04/19/2024 (GMT)
- 94
- 0
Click here for a new analysis!
- Timeframe : 1H
- - Analysis generated on
- Status : TARGET REACHED

Summary of the analysis

Additional analysis
Quotes
The ESTX TELECOM EUR (PRICE) rating is 278.20 EUR. The price has increased by +1.05% since the last closing with the lowest point at 274.85 EUR and the highest point at 278.33 EUR. The deviation from the price is +1.22% for the low point and -0.05% for the high point.The Central Gaps scanner detects a bearish opening. A small advantage for sellers in the very short term.
Bearish opening
Type : Bearish
Timeframe : Openning
So that you have an overall view of the price change, here is a table showing the variations over several periods:
Near a new LOW record (1 year)
Type : Bearish
Timeframe : Weekly
Near a new LOW record (1st january)
Type : Bearish
Timeframe : Weekly
Near a new HIGH record (1 month)
Type : Bullish
Timeframe : Weekly
Technical
Technical analysis of ESTX TELECOM EUR (PRICE) in 1H shows an overall slightly bullish trend. 57.14% of the signals given by moving averages are bullish. This slightly bullish trend could be reinforced by the strong bullish signals given by short-term moving averages. The Central Indicators market scanner is currently detecting a bullish signal that could impact this trend:
Moving Average bullish crossovers : AMA20 & AMA50
Type : Bullish
Timeframe : 1 hour
Technical indicators are strongly bullish, suggesting that the price increase should continue.
But beware of excesses. The Central Indicators scanner currently detects this:
RSI indicator is overbought : over 70
Type : Neutral
Timeframe : 1 hour
CCI indicator is overbought : over 100
Type : Neutral
Timeframe : 1 hour
Previous candle closed over Bollinger bands
Type : Neutral
Timeframe : 1 hour
Williams %R indicator is overbought : over -20
Type : Neutral
Timeframe : 1 hour
Pivot points : price is over resistance 2
Type : Neutral
Timeframe : 1 hour
Central Patterns, the scanner specializing in chart patterns, did not identify any signals.
No result was found by the Central Candlesticks scanner on Japanese candlesticks.
| S3 | S2 | S1 | Price | R1 | R2 | R3 | |
|---|---|---|---|---|---|---|---|
| ProTrendLines | 270.62 | 273.38 | 275.86 | 278.20 | 279.47 | 282.88 | 286.51 |
| Change (%) | -2.72% | -1.73% | -0.84% | - | +0.46% | +1.68% | +2.99% |
| Change | -7.58 | -4.82 | -2.34 | - | +1.27 | +4.68 | +8.31 |
| Level | Minor | Intermediate | Major | - | Minor | Minor | Intermediate |
Pivot points can also be used to set your price objectives. Here is the price situation in relation to pivot points:
| Pivot points | S3 | S2 | S1 | PP | R1 | R2 | R3 |
|---|---|---|---|---|---|---|---|
| Standard | 270.85 | 271.86 | 273.58 | 274.59 | 276.31 | 277.32 | 279.04 |
| Camarilla | 274.55 | 274.80 | 275.05 | 275.30 | 275.55 | 275.80 | 276.05 |
| Woodie | 271.21 | 272.04 | 273.94 | 274.77 | 276.67 | 277.50 | 279.40 |
| Fibonacci | 271.86 | 272.90 | 273.55 | 274.59 | 275.63 | 276.28 | 277.32 |
| Pivot points | S3 | S2 | S1 | PP | R1 | R2 | R3 |
|---|---|---|---|---|---|---|---|
| Standard | 261.39 | 268.42 | 272.48 | 279.51 | 283.57 | 290.60 | 294.66 |
| Camarilla | 273.49 | 274.51 | 275.52 | 276.54 | 277.56 | 278.57 | 279.59 |
| Woodie | 259.91 | 267.68 | 271.00 | 278.77 | 282.09 | 289.86 | 293.18 |
| Fibonacci | 268.42 | 272.66 | 275.27 | 279.51 | 283.75 | 286.36 | 290.60 |
| Pivot points | S3 | S2 | S1 | PP | R1 | R2 | R3 |
|---|---|---|---|---|---|---|---|
| Standard | 270.79 | 274.85 | 281.81 | 285.87 | 292.83 | 296.89 | 303.85 |
| Camarilla | 285.75 | 286.76 | 287.77 | 288.78 | 289.79 | 290.80 | 291.81 |
| Woodie | 272.25 | 275.58 | 283.27 | 286.60 | 294.29 | 297.62 | 305.31 |
| Fibonacci | 274.85 | 279.06 | 281.66 | 285.87 | 290.08 | 292.68 | 296.89 |
Numerical data
The following are the details of the technical indicators and moving averages that were collected to generate this technical analysis:
| RSI (14): | 70.41 | |
| MACD (12,26,9): | 0.6400 | |
| Directional Movement: | 19.12 | |
| AROON (14): | 85.71 | |
| DEMA (21): | 275.69 | |
| Parabolic SAR (0,02-0,02-0,2): | 275.42 | |
| Elder Ray (13): | 2.09 | |
| Super Trend (3,10): | 274.52 | |
| Zig ZAG (10): | 278.06 | |
| VORTEX (21): | 1.3200 | |
| Stochastique (14,3,5): | 92.87 | |
| TEMA (21): | 276.87 | |
| Williams %R (14): | -5.26 | |
| Chande Momentum Oscillator (20): | 3.10 | |
| Repulse (5,40,3): | 0.9200 | |
| ROCnROLL: | 1 | |
| TRIX (15,9): | 0.0100 | |
| Courbe Coppock: | 1.92 |
| MA7: | 275.14 | |
| MA20: | 281.33 | |
| MA50: | 282.29 | |
| MA100: | 283.94 | |
| MAexp7: | 276.40 | |
| MAexp20: | 275.14 | |
| MAexp50: | 275.71 | |
| MAexp100: | 277.82 | |
| Price / MA7: | +1.11% | |
| Price / MA20: | -1.11% | |
| Price / MA50: | -1.45% | |
| Price / MA100: | -2.02% | |
| Price / MAexp7: | +0.65% | |
| Price / MAexp20: | +1.11% | |
| Price / MAexp50: | +0.90% | |
| Price / MAexp100: | +0.14% |
About author
Online


Add a comment
Comments
0 comments on the analysis ESTX TELECOM EUR (PRICE) - 1H