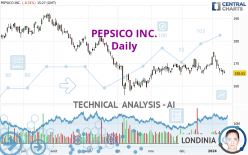
PEPSICO INC. - Daily - Technical analysis published on 01/12/2024 (GMT)
- 118
- 0
Click here for a new analysis!
- Timeframe : Daily
- - Analysis generated on
- Status : LEVEL MAINTAINED

Summary of the analysis

Additional analysis
Quotes
The PEPSICO INC. rating is 165.61 USD. The price registered a decrease of -0.31% on the session and was traded between 165.57 USD and 166.81 USD over the period. The price is currently at +0.02% from its lowest and -0.72% from its highest.A bullish opening was detected by the Central Gaps scanner. Buyers are trying to impose a bullish momentum in the very short term.
Bullish opening
Type : Bullish
Timeframe : Openning
So that you have an overall view of the price change, here is a table showing the variations over several periods:
Near a new LOW record (1st january)
Type : Bearish
Timeframe : Weekly
Near a new LOW record (1 month)
Type : Bearish
Timeframe : Weekly
Technical
A technical analysis in Daily of this PEPSICO INC. chart shows a bearish trend. The signals given by moving averages are 75.00% bearish. This bearish trend is reinforced by the strong signals currently being given by short-term moving averages. There is no crossing of moving average by the price or crossing of moving averages between themselves.
An assessment of technical indicators shows a bearish signal.
But beware of excesses. The Central Indicators scanner currently detects this:
CCI indicator is oversold : under -100
Type : Neutral
Timeframe : Daily
CCI indicator: bullish divergence
Type : Bullish
Timeframe : Daily
Williams %R indicator is oversold : under -80
Type : Neutral
Timeframe : Daily
Pivot points : price is under support 1
Type : Neutral
Timeframe : Weekly
MACD indicator is back under 0
Type : Bearish
Timeframe : Daily
Price is back under the pivot point
Type : Bearish
Timeframe : Daily
An analysis of the price chart with the Central Patterns scanner (detector of chart patterns and resistances and supports) shows several results that can have an impact on the price change:
Near horizontal support
Type : Bullish
Timeframe : Daily
Near support of channel
Type : Bullish
Timeframe : Daily
No result was found by the Central Candlesticks scanner on Japanese candlesticks.
| S3 | S2 | S1 | Price | R1 | R2 | R3 | |
|---|---|---|---|---|---|---|---|
| ProTrendLines | 156.58 | 160.96 | 164.39 | 165.61 | 173.04 | 177.51 | 180.70 |
| Change (%) | -5.45% | -2.81% | -0.74% | - | +4.49% | +7.19% | +9.11% |
| Change | -9.03 | -4.65 | -1.22 | - | +7.43 | +11.90 | +15.09 |
| Level | Major | Minor | Major | - | Intermediate | Intermediate | Minor |
To determine price objectives, it is also possible to use the pivot points. Here is the price position in relation to pivot points:
| Pivot points | S3 | S2 | S1 | PP | R1 | R2 | R3 |
|---|---|---|---|---|---|---|---|
| Standard | 162.60 | 163.71 | 164.92 | 166.03 | 167.24 | 168.35 | 169.56 |
| Camarilla | 165.49 | 165.71 | 165.92 | 166.13 | 166.34 | 166.56 | 166.77 |
| Woodie | 162.65 | 163.74 | 164.97 | 166.06 | 167.29 | 168.38 | 169.61 |
| Fibonacci | 163.71 | 164.60 | 165.14 | 166.03 | 166.92 | 167.46 | 168.35 |
| Pivot points | S3 | S2 | S1 | PP | R1 | R2 | R3 |
|---|---|---|---|---|---|---|---|
| Standard | 158.29 | 162.93 | 165.93 | 170.57 | 173.57 | 178.21 | 181.21 |
| Camarilla | 166.84 | 167.54 | 168.24 | 168.94 | 169.64 | 170.34 | 171.04 |
| Woodie | 157.48 | 162.52 | 165.12 | 170.16 | 172.76 | 177.80 | 180.40 |
| Fibonacci | 162.93 | 165.85 | 167.65 | 170.57 | 173.49 | 175.29 | 178.21 |
| Pivot points | S3 | S2 | S1 | PP | R1 | R2 | R3 |
|---|---|---|---|---|---|---|---|
| Standard | 159.28 | 162.27 | 166.06 | 169.05 | 172.84 | 175.83 | 179.62 |
| Camarilla | 167.98 | 168.60 | 169.22 | 169.84 | 170.46 | 171.08 | 171.71 |
| Woodie | 159.67 | 162.47 | 166.45 | 169.25 | 173.23 | 176.03 | 180.01 |
| Fibonacci | 162.27 | 164.86 | 166.46 | 169.05 | 171.64 | 173.24 | 175.83 |
Numerical data
The following are the details of the technical indicators and moving averages that were collected to generate this technical analysis:
| RSI (14): | 41.69 | |
| MACD (12,26,9): | -0.0800 | |
| Directional Movement: | -5.92 | |
| AROON (14): | -42.86 | |
| DEMA (21): | 168.48 | |
| Parabolic SAR (0,02-0,02-0,2): | 174.43 | |
| Elder Ray (13): | -1.95 | |
| Super Trend (3,10): | 172.89 | |
| Zig ZAG (10): | 165.88 | |
| VORTEX (21): | 0.9100 | |
| Stochastique (14,3,5): | 12.62 | |
| TEMA (21): | 167.83 | |
| Williams %R (14): | -90.37 | |
| Chande Momentum Oscillator (20): | -3.15 | |
| Repulse (5,40,3): | -1.0200 | |
| ROCnROLL: | 2 | |
| TRIX (15,9): | 0.0500 | |
| Courbe Coppock: | 0.08 |
| MA7: | 167.91 | |
| MA20: | 168.56 | |
| MA50: | 167.53 | |
| MA100: | 168.18 | |
| MAexp7: | 167.47 | |
| MAexp20: | 168.27 | |
| MAexp50: | 167.98 | |
| MAexp100: | 169.28 | |
| Price / MA7: | -1.37% | |
| Price / MA20: | -1.75% | |
| Price / MA50: | -1.15% | |
| Price / MA100: | -1.53% | |
| Price / MAexp7: | -1.11% | |
| Price / MAexp20: | -1.58% | |
| Price / MAexp50: | -1.41% | |
| Price / MAexp100: | -2.17% |
News
The last news published on PEPSICO INC. at the time of the generation of this analysis was as follows:
- PepsiCo, Inc. Announces Pre Stabilisation Notice
- Enjoy Infinite Hydration In Style with New Drinkfinity Bottle
- PepsiCo, Inc Announces Pre Stabilisation Notice
- Families, Invent Away! Frito-Lay Announces Return of "Dreamvention" to Find the Next Best Invention Idea
-
 Tesla Shares Pop After Pepsi Places Order For Electric Semi Trucks | CNBC
About author

Online


Add a comment
Comments
0 comments on the analysis PEPSICO INC. - Daily