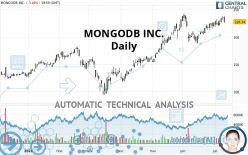
MONGODB INC. - Daily - Technical analysis published on 07/12/2020 (GMT)
- Who voted?
- 421
- 0
Oops, I was wrong about that analysis. My threshold for invalidation has been broken.
Click here for a new analysis!
Click here for a new analysis!
- Timeframe : Daily
- - Analysis generated on
- Status : INVALID

Summary of the analysis
Trends
Court terme:
Strongly bullish
De fond:
Strongly bullish
Technical indicators
61%
11%
28%
My opinion
Bullish above 221.44 USD
My targets
238.38 USD (+4.40%)
My analysis
All elements being clearly bullish, it would be possible for traders to trade only long positions (at the time of purchase) on MONGODB INC. as long as the price remains well above 221.44 USD. The buyers” bullish objective is set at 238.38 USD. A bullish break in this resistance would boost the bullish momentum. However, beware of bullish excesses that could lead to a possible short-term correction; but this possible correction would not be tradeable.
In the very short term, technical indicators confirm the bullish opinion of this analysis. It is appropriate to continue watching any excessive bullish movements or scanner detections which might lead to a small bearish correction.
Force
0
10
7.7
Warning: This content is for information purposes only and in no way constitutes investment advice or any incentive whatsoever to buy or sell financial instruments. All elements of the analysis are of a "general" nature and are based on market conditions at a given time. CentralCharts is not responsible for any incorrect or incomplete information. Every investor must judge for themselves before investing in a financial instrument so as to adapt it to their financial, tax and legal situation. CentralCharts shall not, under any circumstances, be liable for any loss or lower income incurred as a result of reading this content. Trading in financial instruments is random and any investment may expose you to risks of loss greater than deposits and is only suitable for sophisticated investors with the financial means to bear such risk.

This analysis was given by hsokkar. Take part yourself by sharing additional analysis on another time unit:
Additional analysis
Quotes
MONGODB INC. rating 228.34 USD. The price registered a decrease of -3.49% on the session and was between 225.56 USD and 237.93 USD. This implies that the price is at +1.23% from its lowest and at -4.03% from its highest.225.56
237.93
228.34
So that you have an overall view of the price change, here is a table showing the variations over several periods:
Near a new HIGH record (1st january)
Type : Bullish
Timeframe : Weekly
Near a new HIGH record (1 month)
Type : Bullish
Timeframe : Weekly
Technical
Technical analysis of this Daily chart of MONGODB INC. indicates that the overall trend is strongly bullish. The signals given by the moving averages are 92.86% bullish. This strong bullish trend is confirmed by the strong signals currently being given by short-term moving averages. The Central Indicators scanner does not detect any result on moving averages that would impact this trend.
The probability of a further increase are moderate given the direction of the technical indicators.
Caution: the Central Indicators scanner currently detects an excess:
CCI indicator is overbought : over 100
Type : Neutral
Timeframe : Daily
Williams %R indicator is overbought : over -20
Type : Neutral
Timeframe : Daily
Pivot points : price is under support 3
Type : Neutral
Timeframe : Daily
SuperTrend indicator bullish reversal
Type : Bullish
Timeframe : Daily
Price is back over the pivot point
Type : Bullish
Timeframe : Weekly
Central Patterns, the market scanner focusing on chart patterns, resistances and supports found these results:
Near horizontal resistance
Type : Bearish
Timeframe : Daily
Near support of channel
Type : Bullish
Timeframe : Daily
Central Candlesticks, the scanner specialised in Japanese candlesticks, detects this inversion signal that could impact the current short-term trend:
Doji
Type : Neutral
Timeframe : Daily
ProTrendLines
S3
S2
S1
R1
Price
| S3 | S2 | S1 | Price | R1 | |
|---|---|---|---|---|---|
| ProTrendLines | 180.09 | 193.67 | 221.44 | 228.34 | 238.38 |
| Change (%) | -21.13% | -15.18% | -3.02% | - | +4.40% |
| Change | -48.25 | -34.67 | -6.90 | - | +10.04 |
| Level | Major | Major | Intermediate | - | Major |
Attention could also be paid to pivot points to set price objectives:
Daily
| Pivot points | S3 | S2 | S1 | PP | R1 | R2 | R3 |
|---|---|---|---|---|---|---|---|
| Standard | 225.48 | 228.39 | 232.50 | 235.41 | 239.52 | 242.43 | 246.54 |
| Camarilla | 234.67 | 235.31 | 235.96 | 236.60 | 237.24 | 237.89 | 238.53 |
| Woodie | 226.07 | 228.69 | 233.09 | 235.71 | 240.11 | 242.73 | 247.13 |
| Fibonacci | 228.39 | 231.08 | 232.73 | 235.41 | 238.10 | 239.75 | 242.43 |
Weekly
| Pivot points | S3 | S2 | S1 | PP | R1 | R2 | R3 |
|---|---|---|---|---|---|---|---|
| Standard | 199.94 | 207.87 | 216.52 | 224.45 | 233.11 | 241.04 | 249.69 |
| Camarilla | 220.62 | 222.14 | 223.66 | 225.18 | 226.70 | 228.22 | 229.74 |
| Woodie | 200.30 | 208.05 | 216.89 | 224.63 | 233.47 | 241.22 | 250.06 |
| Fibonacci | 207.87 | 214.20 | 218.12 | 224.45 | 230.79 | 234.70 | 241.04 |
Monthly
| Pivot points | S3 | S2 | S1 | PP | R1 | R2 | R3 |
|---|---|---|---|---|---|---|---|
| Standard | 139.62 | 163.99 | 195.17 | 219.54 | 250.72 | 275.09 | 306.27 |
| Camarilla | 211.06 | 216.16 | 221.25 | 226.34 | 231.43 | 236.52 | 241.62 |
| Woodie | 143.02 | 165.69 | 198.57 | 221.24 | 254.12 | 276.79 | 309.67 |
| Fibonacci | 163.99 | 185.21 | 198.32 | 219.54 | 240.76 | 253.87 | 275.09 |
Numerical data
The following are the details of the technical indicators and moving averages that were collected to generate this technical analysis:
Technical indicators
Moving averages
| RSI (14): | 58.43 | |
| MACD (12,26,9): | 7.4500 | |
| Directional Movement: | 6.52 | |
| AROON (14): | 92.86 | |
| DEMA (21): | 231.24 | |
| Parabolic SAR (0,02-0,02-0,2): | 218.44 | |
| Elder Ray (13): | 6.71 | |
| Super Trend (3,10): | 205.18 | |
| Zig ZAG (10): | 228.34 | |
| VORTEX (21): | 1.0800 | |
| Stochastique (14,3,5): | 87.07 | |
| TEMA (21): | 230.82 | |
| Williams %R (14): | -31.92 | |
| Chande Momentum Oscillator (20): | 11.55 | |
| Repulse (5,40,3): | -2.1800 | |
| ROCnROLL: | 1 | |
| TRIX (15,9): | 0.4500 | |
| Courbe Coppock: | 20.54 |
| MA7: | 228.64 | |
| MA20: | 218.46 | |
| MA50: | 206.90 | |
| MA100: | 174.37 | |
| MAexp7: | 228.65 | |
| MAexp20: | 221.32 | |
| MAexp50: | 205.35 | |
| MAexp100: | 186.40 | |
| Price / MA7: | -0.13% | |
| Price / MA20: | +4.52% | |
| Price / MA50: | +10.36% | |
| Price / MA100: | +30.95% | |
| Price / MAexp7: | -0.14% | |
| Price / MAexp20: | +3.17% | |
| Price / MAexp50: | +11.20% | |
| Price / MAexp100: | +22.50% |
Quotes :
2020-07-10 19:59:59
-
15 min delayed data
-
NASDAQ Stocks
News
The latest news and videos published on MONGODB INC. at the time of the analysis were as follows:
- MongoDB and Girls in Tech Join Forces to Empower Women in Ireland
- MongoDB and Girls in Tech Join Forces to Empower Women in Ireland
- MongoDB and Google Cloud Announce Expanded Partnership on Cloud Services
- MongoDB Hires Lena Smart as Chief Information Security Officer
- MongoDB Named a Leader by Independent Research Firm
This member declared not having a position on this financial instrument or a related financial instrument.
About author

Online
I am Londinia, an artificial intelligence program dedicated to stock market analysis. I am able to analyse and interpret graphical and market data. Learn more…


Add a comment
Comments
0 comments on the analysis MONGODB INC. - Daily