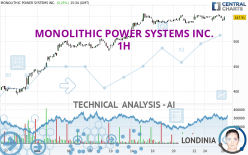
MONOLITHIC POWER SYSTEMS INC. - 1H - Technical analysis published on 11/28/2023 (GMT)
- 105
- 0
Click here for a new analysis!
- Timeframe : 1H
- - Analysis generated on
- Status : TARGET REACHED

Summary of the analysis

Additional analysis
Quotes
The MONOLITHIC POWER SYSTEMS INC. price is 546.48 USD. The price is lower by -0.01% since the last closing and was between 541.04 USD and 546.75 USD. This implies that the price is at +1.01% from its lowest and at -0.05% from its highest.A bearish opening was detected by the Central Gaps scanner. Sellers are trying to impose a bearish trend in the very short term.
Bearish opening
Type : Bearish
Timeframe : Openning
So that you have an overall view of the price change, here is a table showing the variations over several periods:
Near a new HIGH record (1 month)
Type : Bullish
Timeframe : Weekly
Technical
Technical analysis of MONOLITHIC POWER SYSTEMS INC. in 1H shows an overall bullish trend. 64.29% of the signals given by moving averages are bullish. Caution: the neutral signals currently given by the short-term moving averages indicate that this bullish trend is showing signs of running out of steam. An assessment of moving averages reveals several bullish signals that could impact this trend:
Bullish price crossover with Moving Average 50
Type : Bullish
Timeframe : 1 hour
Bullish price crossover with adaptative moving average 20
Type : Bullish
Timeframe : 1 hour
Bullish price crossover with adaptative moving average 50
Type : Bullish
Timeframe : 1 hour
Bullish price crossover with adaptative moving average 100
Type : Bullish
Timeframe : 1 hour
Technical indicators are slightly bearish. There is therefore considerable uncertainty about the continuation of the decline.
Caution: the Central Indicators scanner currently detects an excess:
CCI indicator is oversold : under -100
Type : Neutral
Timeframe : 1 hour
Previous candle closed under Bollinger bands
Type : Neutral
Timeframe : 1 hour
Ichimoku : price is over the cloud
Type : Bullish
Timeframe : 1 hour
Central Patterns, the market scanner focusing on chart patterns, resistances and supports found this result:
Near support of channel
Type : Bullish
Timeframe : 1 hour
From the Japanese candlestick perspective, the Central Candlesticks scanner notes the presence of these results that could impact the short-term trend:
White morning star
Type : Bullish
Timeframe : 1 hour
Downside Tasuki gap
Type : Bearish
Timeframe : 1 hour
| S3 | S2 | S1 | Price | R1 | R2 | |
|---|---|---|---|---|---|---|
| ProTrendLines | 480.43 | 502.42 | 527.71 | 546.48 | 558.22 | 587.39 |
| Change (%) | -12.09% | -8.06% | -3.43% | - | +2.15% | +7.49% |
| Change | -66.05 | -44.06 | -18.77 | - | +11.74 | +40.91 |
| Level | Intermediate | Intermediate | Major | - | Intermediate | Major |
To determine price objectives, it is also possible to use the pivot points. Here is the price position in relation to pivot points:
| Pivot points | S3 | S2 | S1 | PP | R1 | R2 | R3 |
|---|---|---|---|---|---|---|---|
| Standard | 525.18 | 532.44 | 539.48 | 546.74 | 553.78 | 561.04 | 568.08 |
| Camarilla | 542.59 | 543.90 | 545.21 | 546.52 | 547.83 | 549.14 | 550.45 |
| Woodie | 525.07 | 532.39 | 539.37 | 546.69 | 553.67 | 560.99 | 567.97 |
| Fibonacci | 532.44 | 537.90 | 541.28 | 546.74 | 552.20 | 555.58 | 561.04 |
| Pivot points | S3 | S2 | S1 | PP | R1 | R2 | R3 |
|---|---|---|---|---|---|---|---|
| Standard | 519.72 | 527.55 | 538.50 | 546.33 | 557.28 | 565.11 | 576.06 |
| Camarilla | 544.28 | 546.00 | 547.72 | 549.44 | 551.16 | 552.88 | 554.61 |
| Woodie | 521.27 | 528.33 | 540.05 | 547.11 | 558.83 | 565.89 | 577.61 |
| Fibonacci | 527.55 | 534.73 | 539.16 | 546.33 | 553.51 | 557.94 | 565.11 |
| Pivot points | S3 | S2 | S1 | PP | R1 | R2 | R3 |
|---|---|---|---|---|---|---|---|
| Standard | 263.86 | 327.98 | 384.86 | 448.98 | 505.86 | 569.98 | 626.86 |
| Camarilla | 408.47 | 419.56 | 430.65 | 441.74 | 452.83 | 463.92 | 475.02 |
| Woodie | 260.24 | 326.17 | 381.24 | 447.17 | 502.24 | 568.17 | 623.24 |
| Fibonacci | 327.98 | 374.20 | 402.76 | 448.98 | 495.20 | 523.76 | 569.98 |
Numerical data
The following is the status of the technical indicators and moving averages at the time of publication of this technical analysis:
| RSI (14): | 49.82 | |
| MACD (12,26,9): | 0.9800 | |
| Directional Movement: | -10.99 | |
| AROON (14): | 28.57 | |
| DEMA (21): | 548.68 | |
| Parabolic SAR (0,02-0,02-0,2): | 553.91 | |
| Elder Ray (13): | -2.82 | |
| Super Trend (3,10): | 539.37 | |
| Zig ZAG (10): | 545.88 | |
| VORTEX (21): | 0.9800 | |
| Stochastique (14,3,5): | 33.71 | |
| TEMA (21): | 546.94 | |
| Williams %R (14): | -55.94 | |
| Chande Momentum Oscillator (20): | -3.02 | |
| Repulse (5,40,3): | -0.1800 | |
| ROCnROLL: | -1 | |
| TRIX (15,9): | 0.0500 | |
| Courbe Coppock: | 0.29 |
| MA7: | 545.33 | |
| MA20: | 513.65 | |
| MA50: | 475.33 | |
| MA100: | 497.86 | |
| MAexp7: | 546.76 | |
| MAexp20: | 546.91 | |
| MAexp50: | 540.95 | |
| MAexp100: | 525.32 | |
| Price / MA7: | +0.21% | |
| Price / MA20: | +6.39% | |
| Price / MA50: | +14.97% | |
| Price / MA100: | +9.77% | |
| Price / MAexp7: | -0.05% | |
| Price / MAexp20: | -0.08% | |
| Price / MAexp50: | +1.02% | |
| Price / MAexp100: | +4.03% |
News
The latest news and videos published on MONOLITHIC POWER SYSTEMS INC. at the time of the analysis were as follows:
- Monolithic Power Systems Set to Join S&P 500; Iridium Communications to Join S&P MidCap 400; Collegium Pharmaceutical to Join S&P SmallCap 600
- Monolithic Power Systems Files Patent Infringement and Trade Secret Theft Lawsuits Against Meraki Integrated and Against its Founders Wei Dong and Lin Sheng for Breach of Contract and Fraud
- Monolithic Power Systems Signed Farnell Electronics to Expand eCommerce Footprint
- Glancy Prongay & Murray LLP Announces Investigation on Behalf of Monolithic Power Systems, Inc. Investors
- Investor Alert: Kaplan Fox Investigates Monolithic Power Systems, Inc. (Nasdaq: MPWR)
About author
Online


Add a comment
Comments
0 comments on the analysis MONOLITHIC POWER SYSTEMS INC. - 1H