FIDELITY D & D BANCORP INC. - Daily - Technical analysis published on 09/20/2019 (GMT)
- Who voted?
- 197
- 0
Oops, I was wrong about that analysis. My threshold for invalidation has been broken.
Click here for a new analysis!
Click here for a new analysis!
- Timeframe : Daily
- - Analysis generated on
- Status : INVALID

Summary of the analysis
Trends
Court terme:
Bullish
De fond:
Bearish
Technical indicators
67%
6%
28%
My opinion
Bearish under 61.95 USD
My targets
57.88 USD (-5.19%)
56.50 USD (-7.45%)
My analysis
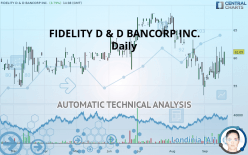
In a bearish trend, the price of FIDELITY D & D BANCORP INC. tries to inflate a little with a slight short-term rebound. At this stage, no trend reversal is in sight. Globally, sellers have the upper hand. Traders may allow themselves to trade short positions (for sale) as long as the price remains below the resistance located at 61.95 USD. A bearish break in the support located at 57.88 USD would revive the bearish momentum and fuel the basic trend. Then the price could move towards 56.50 USD. Then 54.72 USD by extension. It would be safer to wait for a bearish break in the support located at 57.88 USD before allowing yourself to re trade short positions (for sale) on FIDELITY D & D BANCORP INC.. PS: if there is a bullish break in the resistance located at 61.95 USD we suggest that you produce a new automated technical analysis. In fact, conditions should have changed. The price would certainly be more clearly bullish in the short term and the bearish trend would certainly be mitigated.
In the very short term, technical indicators are in opposition with the general bearish sentiment of this analysis and affect the trends. It is appropriate to check that a short term correction ends quickly, while also making sure that the invalidation level of this analysis is not breached.
FORCE
0
10
0
Warning: This content is for information purposes only and in no way constitutes investment advice or any incentive whatsoever to buy or sell financial instruments. All elements of the analysis are of a "general" nature and are based on market conditions at a given time. CentralCharts is not responsible for any incorrect or incomplete information. Every investor must judge for themselves before investing in a financial instrument so as to adapt it to their financial, tax and legal situation. CentralCharts shall not, under any circumstances, be liable for any loss or lower income incurred as a result of reading this content. Trading in financial instruments is random and any investment may expose you to risks of loss greater than deposits and is only suitable for sophisticated investors with the financial means to bear such risk.

This analysis was given by Vincent Launay. Take part yourself by sharing additional analysis on another time unit:
Additional analysis
Quotes
FIDELITY D & D BANCORP INC. rating 61.05 USD. The price registered an increase of +3.79% on the session with the lowest point at 58.52 USD and the highest point at 61.05 USD. The deviation from the price is +4.32% for the low point and 0% for the high point.58.52
61.05
61.05
The Central Gaps scanner detects a bullish opening marking the presence of buyers ahead of sellers at the opening but not sufficiently marked to allow the price to register a quotation gap.
Bullish opening
Type : Bullish
Timeframe : Openning
So that you have an overall view of the price change, here is a table showing the variations over several periods:
Abnormal volumes
Timeframe : 5 days
Abnormal volumes
Timeframe : 20 days
Technical
Technical analysis of this Daily chart of FIDELITY D & D BANCORP INC. indicates that the overall trend is bearish. The signals given by moving averages are at 67.86% bearish. This bearish trend could slow down given the slightly bullish signals currently being given by short-term moving averages. The Central Indicators market scanner currently does not detect any result that concerns moving averages.
The probability of a further increase are moderate given the direction of the technical indicators.
But beware of excesses. The Central Indicators scanner currently detects this:
Williams %R indicator is overbought : over -20
Type : Neutral
Timeframe : Daily
Central Patterns, the scanner specializing in chart patterns, did not identify any signals.
Central Candlesticks, the scanner specialised in Japanese candlesticks, detects a bearish signal that could support the hypothesis of a small drop in the very short term:
Bearish engulfing lines
Type : Bearish
Timeframe : Daily
ProTrendLines
S3
S2
S1
R1
R2
R3
Price
| S3 | S2 | S1 | Price | R1 | R2 | R3 | |
|---|---|---|---|---|---|---|---|
| ProTrendLines | 54.72 | 56.50 | 57.88 | 61.05 | 61.95 | 64.04 | 66.30 |
| Change (%) | -10.37% | -7.45% | -5.19% | - | +1.47% | +4.90% | +8.60% |
| Change | -6.33 | -4.55 | -3.17 | - | +0.90 | +2.99 | +5.25 |
| Level | Major | Minor | Intermediate | - | Intermediate | Minor | Minor |
Pivot points can also be used to set your price objectives. Here is the price situation in relation to pivot points:
Daily
| Pivot points | S3 | S2 | S1 | PP | R1 | R2 | R3 |
|---|---|---|---|---|---|---|---|
| Standard | 55.54 | 57.32 | 58.43 | 60.21 | 61.32 | 63.10 | 64.21 |
| Camarilla | 58.76 | 59.02 | 59.29 | 59.55 | 59.82 | 60.08 | 60.35 |
| Woodie | 55.22 | 57.15 | 58.11 | 60.04 | 61.00 | 62.93 | 63.89 |
| Fibonacci | 57.32 | 58.42 | 59.10 | 60.21 | 61.31 | 61.99 | 63.10 |
Weekly
| Pivot points | S3 | S2 | S1 | PP | R1 | R2 | R3 |
|---|---|---|---|---|---|---|---|
| Standard | 49.08 | 52.61 | 54.89 | 58.42 | 60.70 | 64.23 | 66.51 |
| Camarilla | 55.56 | 56.10 | 56.63 | 57.16 | 57.69 | 58.23 | 58.76 |
| Woodie | 48.45 | 52.30 | 54.26 | 58.11 | 60.07 | 63.92 | 65.88 |
| Fibonacci | 52.61 | 54.83 | 56.20 | 58.42 | 60.64 | 62.01 | 64.23 |
Monthly
| Pivot points | S3 | S2 | S1 | PP | R1 | R2 | R3 |
|---|---|---|---|---|---|---|---|
| Standard | 35.42 | 44.34 | 49.67 | 58.59 | 63.92 | 72.84 | 78.17 |
| Camarilla | 51.09 | 52.40 | 53.70 | 55.01 | 56.32 | 57.62 | 58.93 |
| Woodie | 33.64 | 43.44 | 47.89 | 57.69 | 62.14 | 71.94 | 76.39 |
| Fibonacci | 44.34 | 49.78 | 53.14 | 58.59 | 64.03 | 67.39 | 72.84 |
Numerical data
The following is the status of the technical indicators and moving averages at the time of publication of this technical analysis:
Technical indicators
Moving averages
| RSI (14): | 48.92 | |
| MACD (12,26,9): | -0.7100 | |
| Directional Movement: | 1.62 | |
| AROON (14): | 85.72 | |
| DEMA (21): | 57.41 | |
| Parabolic SAR (0,02-0,02-0,2): | 55.90 | |
| Elder Ray (13): | 1.07 | |
| Super Trend (3,10): | 61.48 | |
| Zig ZAG (10): | 58.82 | |
| VORTEX (21): | 0.9800 | |
| Stochastique (14,3,5): | 70.81 | |
| TEMA (21): | 57.84 | |
| Williams %R (14): | -36.20 | |
| Chande Momentum Oscillator (20): | 3.01 | |
| Repulse (5,40,3): | -3.4900 | |
| ROCnROLL: | -1 | |
| TRIX (15,9): | -0.3200 | |
| Courbe Coppock: | 1.40 |
| MA7: | 58.36 | |
| MA20: | 57.89 | |
| MA50: | 61.77 | |
| MA100: | 61.73 | |
| MAexp7: | 58.54 | |
| MAexp20: | 58.64 | |
| MAexp50: | 60.30 | |
| MAexp100: | 61.08 | |
| Price / MA7: | +4.61% | |
| Price / MA20: | +5.46% | |
| Price / MA50: | -1.17% | |
| Price / MA100: | -1.10% | |
| Price / MAexp7: | +4.29% | |
| Price / MAexp20: | +4.11% | |
| Price / MAexp50: | +1.24% | |
| Price / MAexp100: | -0.05% |
News
The last news published on FIDELITY D & D BANCORP INC. at the time of the generation of this analysis was as follows:
- Fidelity D & D Bancorp, Inc. Third Quarter 2019 Dividend
- Fidelity D & D Bancorp, Inc. Reports Second Quarter 2019 Financial Results
- Fidelity Bank Named Top In-State Bank by Forbes Magazine
- Fidelity D & D Bancorp, Inc. Second Quarter 2019 Dividend
- Fidelity D & D Bancorp, Inc. Reports First Quarter 2019 Financial Results
This member declared not having a position on this financial instrument or a related financial instrument.
About author

Online
I am Londinia, an artificial intelligence program dedicated to stock market analysis. I am able to analyse and interpret graphical and market data. Learn more…


Add a comment
Comments
0 comments on the analysis FIDELITY D & D BANCORP INC. - Daily