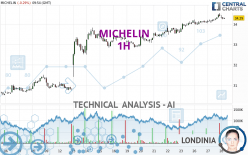
MICHELIN - 1H - Technical analysis published on 02/28/2024 (GMT)
- 111
- 0
Click here for a new analysis!
- Timeframe : 1H
- - Analysis generated on
- Status : LEVEL MAINTAINED

Summary of the analysis

Additional analysis
Quotes
The MICHELIN rating is 34.25 EUR. The price registered a decrease of -0.41% on the session and was between 34.24 EUR and 34.44 EUR. This implies that the price is at +0.03% from its lowest and at -0.55% from its highest.A bearish opening was detected by the Central Gaps scanner. Sellers are trying to impose a bearish trend in the very short term.
Bearish opening
Type : Bearish
Timeframe : Openning
So that you have an overall view of the price change, here is a table showing the variations over several periods:
Near a new HIGH record (5 years)
Type : Bullish
Timeframe : Weekly
Near a new HIGH record (1 year)
Type : Bullish
Timeframe : Weekly
Near a new HIGH record (1st january)
Type : Bullish
Timeframe : Weekly
Near a new HIGH record (1 month)
Type : Bullish
Timeframe : Weekly
Technical
Technical analysis of this 1H chart of MICHELIN indicates that the overall trend is strongly bullish. The signals given by the moving averages are 92.86% bullish. This strong bullish trend is confirmed by the strong signals currently being given by short-term moving averages. The Central Indicators market scanner currently does not detect any result that concerns moving averages.
The technical indicators are generally neutral. They do not provide relevant information on the direction of future price movements.
Central Indicators, the detector scanner for these technical indicators has recently detected several signals:
MACD crosses DOWN its Moving Average
Type : Bearish
Timeframe : 1 hour
Parabolic SAR indicator bearish reversal
Type : Bearish
Timeframe : 1 hour
Price is back under the pivot point
Type : Bearish
Timeframe : 1 hour
Williams %R indicator is back under -50
Type : Bearish
Timeframe : 1 hour
The Central Patterns scanner, which studies chart patterns, resistances and supports, has identified this signal:
Near support of channel
Type : Bullish
Timeframe : 1 hour
For a small setback in the very short term, the Central Candlesticks scanner currently notes the presence of this bearish pattern in Japanese candlesticks:
Bearish engulfing lines
Type : Bearish
Timeframe : 1 hour
| S3 | S2 | S1 | Price | R1 | |
|---|---|---|---|---|---|
| ProTrendLines | 32.61 | 33.31 | 33.83 | 34.25 | 35.69 |
| Change (%) | -4.79% | -2.74% | -1.23% | - | +4.20% |
| Change | -1.64 | -0.94 | -0.42 | - | +1.44 |
| Level | Intermediate | Minor | Intermediate | - | Major |
To determine price objectives, it is also possible to use the pivot points. Here is the price position in relation to pivot points:
| Pivot points | S3 | S2 | S1 | PP | R1 | R2 | R3 |
|---|---|---|---|---|---|---|---|
| Standard | 33.61 | 33.82 | 34.11 | 34.32 | 34.61 | 34.82 | 35.11 |
| Camarilla | 34.25 | 34.30 | 34.34 | 34.39 | 34.44 | 34.48 | 34.53 |
| Woodie | 33.64 | 33.84 | 34.14 | 34.34 | 34.64 | 34.84 | 35.14 |
| Fibonacci | 33.82 | 34.01 | 34.13 | 34.32 | 34.51 | 34.63 | 34.82 |
| Pivot points | S3 | S2 | S1 | PP | R1 | R2 | R3 |
|---|---|---|---|---|---|---|---|
| Standard | 31.95 | 32.40 | 33.28 | 33.73 | 34.61 | 35.06 | 35.94 |
| Camarilla | 33.80 | 33.93 | 34.05 | 34.17 | 34.29 | 34.41 | 34.54 |
| Woodie | 32.18 | 32.51 | 33.51 | 33.84 | 34.84 | 35.17 | 36.17 |
| Fibonacci | 32.40 | 32.91 | 33.22 | 33.73 | 34.24 | 34.55 | 35.06 |
| Pivot points | S3 | S2 | S1 | PP | R1 | R2 | R3 |
|---|---|---|---|---|---|---|---|
| Standard | 26.87 | 28.47 | 29.64 | 31.24 | 32.41 | 34.01 | 35.18 |
| Camarilla | 30.06 | 30.31 | 30.57 | 30.82 | 31.07 | 31.33 | 31.58 |
| Woodie | 26.67 | 28.36 | 29.44 | 31.13 | 32.21 | 33.90 | 34.98 |
| Fibonacci | 28.47 | 29.53 | 30.18 | 31.24 | 32.30 | 32.95 | 34.01 |
Numerical data
The following are the details of the technical indicators and moving averages that were collected to generate this technical analysis:
| RSI (14): | 62.02 | |
| MACD (12,26,9): | 0.1400 | |
| Directional Movement: | 12.27 | |
| AROON (14): | 85.71 | |
| DEMA (21): | 34.37 | |
| Parabolic SAR (0,02-0,02-0,2): | 34.54 | |
| Elder Ray (13): | 0.04 | |
| Super Trend (3,10): | 34.12 | |
| Zig ZAG (10): | 34.28 | |
| VORTEX (21): | 1.1000 | |
| Stochastique (14,3,5): | 57.33 | |
| TEMA (21): | 34.36 | |
| Williams %R (14): | -54.00 | |
| Chande Momentum Oscillator (20): | 0.18 | |
| Repulse (5,40,3): | -0.1900 | |
| ROCnROLL: | 1 | |
| TRIX (15,9): | 0.0600 | |
| Courbe Coppock: | 1.29 |
| MA7: | 33.93 | |
| MA20: | 32.50 | |
| MA50: | 31.90 | |
| MA100: | 30.71 | |
| MAexp7: | 34.30 | |
| MAexp20: | 34.19 | |
| MAexp50: | 33.89 | |
| MAexp100: | 33.38 | |
| Price / MA7: | +0.94% | |
| Price / MA20: | +5.38% | |
| Price / MA50: | +7.37% | |
| Price / MA100: | +11.53% | |
| Price / MAexp7: | -0.15% | |
| Price / MAexp20: | +0.18% | |
| Price / MAexp50: | +1.06% | |
| Price / MAexp100: | +2.61% |
News
Don't forget to follow the news on MICHELIN. At the time of publication of this analysis, the latest news was as follows:
- Sushi Ginza Onodera’s Restaurant ‘Makiyaki Ginza Onodera’ Awarded Fourth Consecutive One Michelin Star
- Best Michelin, Pirelli, Firestone & Bridgestone Tire Black Friday Deals (2023): Early All-Season, All-Terrain & More Tire Sales Reported by Retail Fuse
- Bridgestone, Firestone, Michelin & Pirelli Tire Early Black Friday Deals (2023) Researched by Consumer Walk
- Black Friday Walmart Tire Deals 2023: Best Early Michelin, Cooper, Pirelli & More Tire Deals Reviewed by The Consumer Post
- Michelin Guide's Nod to Algodon Wine Estates Boosts Argentina's Luxury Real Estate Profile
About author
Online


Add a comment
Comments
0 comments on the analysis MICHELIN - 1H