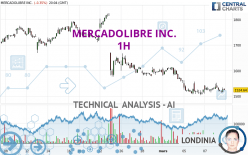
MERCADOLIBRE INC. - 1H - Technical analysis published on 03/08/2024 (GMT)
- 97
- 0
Click here for a new analysis!
- Timeframe : 1H
- - Analysis generated on
- Status : LEVEL MAINTAINED

Summary of the analysis

Additional analysis
Quotes
MERCADOLIBRE INC. rating 1,528.77 USD. The price is lower by -0.08% since the last closing and was between 1,514.00 USD and 1,552.99 USD. This implies that the price is at +0.98% from its lowest and at -1.56% from its highest.The Central Gaps scanner detects a bearish opening marking the presence of sellers ahead of buyers at the opening but not sufficiently marked to allow the price to register a quotation gap.
Bearish opening
Type : Bearish
Timeframe : Openning
Here is a more detailed summary of the historical variations registered by MERCADOLIBRE INC.:
Near a new LOW record (1st january)
Type : Bearish
Timeframe : Weekly
Near a new LOW record (1 month)
Type : Bearish
Timeframe : Weekly
Technical
Technical analysis of this 1H chart of MERCADOLIBRE INC. indicates that the overall trend is bearish. The signals given by moving averages are 78.57% bearish. This bearish trend could slow down given the neutral signals currently being given by short-term moving averages. The Central Indicators market scanner is currently detecting several bullish signals that could impact this trend:
Bullish price crossover with Moving Average 20
Type : Bullish
Timeframe : 1 hour
Bullish price crossover with adaptative moving average 20
Type : Bullish
Timeframe : 1 hour
An assessment of technical indicators shows a slightly bullish signal.
Caution: the Central Indicators scanner currently detects an excess:
RSI indicator: bullish divergence
Type : Bullish
Timeframe : 1 hour
Pivot points : price is under support 2
Type : Neutral
Timeframe : Weekly
Price is back over the pivot point
Type : Bullish
Timeframe : 1 hour
Momentum indicator is back over 0
Type : Bullish
Timeframe : 1 hour
Williams %R indicator is back over -50
Type : Bullish
Timeframe : 1 hour
Central Patterns, the market scanner focusing on chart patterns, resistances and supports found this result:
Near horizontal support
Type : Bullish
Timeframe : 1 hour
The presence of a bullish Japanese candlestick pattern detected by Central Candlesticks that could cause a very short term rebound was also detected:
White morning star
Type : Bullish
Timeframe : 1 hour
| S3 | S2 | S1 | Price | R1 | R2 | R3 | |
|---|---|---|---|---|---|---|---|
| ProTrendLines | 1,296.65 | 1,436.35 | 1,500.00 | 1,528.77 | 1,577.57 | 1,623.01 | 1,668.78 |
| Change (%) | -15.18% | -6.05% | -1.88% | - | +3.19% | +6.16% | +9.16% |
| Change | -232.12 | -92.42 | -28.77 | - | +48.80 | +94.24 | +140.01 |
| Level | Intermediate | Intermediate | Major | - | Intermediate | Major | Minor |
Pivot points can also be used to set your price objectives. Here is the price situation in relation to pivot points:
| Pivot points | S3 | S2 | S1 | PP | R1 | R2 | R3 |
|---|---|---|---|---|---|---|---|
| Standard | 1,479.29 | 1,494.65 | 1,512.29 | 1,527.65 | 1,545.29 | 1,560.65 | 1,578.29 |
| Camarilla | 1,520.87 | 1,523.89 | 1,526.92 | 1,529.94 | 1,532.97 | 1,535.99 | 1,539.02 |
| Woodie | 1,480.44 | 1,495.22 | 1,513.44 | 1,528.22 | 1,546.44 | 1,561.22 | 1,579.44 |
| Fibonacci | 1,494.65 | 1,507.25 | 1,515.04 | 1,527.65 | 1,540.25 | 1,548.04 | 1,560.65 |
| Pivot points | S3 | S2 | S1 | PP | R1 | R2 | R3 |
|---|---|---|---|---|---|---|---|
| Standard | 1,480.98 | 1,529.38 | 1,571.06 | 1,619.46 | 1,661.14 | 1,709.54 | 1,751.22 |
| Camarilla | 1,587.98 | 1,596.24 | 1,604.49 | 1,612.75 | 1,621.01 | 1,629.27 | 1,637.52 |
| Woodie | 1,477.63 | 1,527.70 | 1,567.71 | 1,617.78 | 1,657.79 | 1,707.86 | 1,747.87 |
| Fibonacci | 1,529.38 | 1,563.79 | 1,585.05 | 1,619.46 | 1,653.87 | 1,675.13 | 1,709.54 |
| Pivot points | S3 | S2 | S1 | PP | R1 | R2 | R3 |
|---|---|---|---|---|---|---|---|
| Standard | 1,258.53 | 1,417.77 | 1,506.53 | 1,665.77 | 1,754.53 | 1,913.77 | 2,002.53 |
| Camarilla | 1,527.10 | 1,549.83 | 1,572.57 | 1,595.30 | 1,618.03 | 1,640.77 | 1,663.50 |
| Woodie | 1,223.30 | 1,400.15 | 1,471.30 | 1,648.15 | 1,719.30 | 1,896.15 | 1,967.30 |
| Fibonacci | 1,417.77 | 1,512.50 | 1,571.03 | 1,665.77 | 1,760.50 | 1,819.03 | 1,913.77 |
Numerical data
The following is the status of technical indicators and moving averages registered at the time this technical analysis was created:
| RSI (14): | 49.98 | |
| MACD (12,26,9): | -6.8900 | |
| Directional Movement: | 3.48 | |
| AROON (14): | 71.43 | |
| DEMA (21): | 1,518.13 | |
| Parabolic SAR (0,02-0,02-0,2): | 1,512.32 | |
| Elder Ray (13): | -2.38 | |
| Super Trend (3,10): | 1,560.24 | |
| Zig ZAG (10): | 1,534.26 | |
| VORTEX (21): | 1.0200 | |
| Stochastique (14,3,5): | 32.56 | |
| TEMA (21): | 1,525.13 | |
| Williams %R (14): | -58.25 | |
| Chande Momentum Oscillator (20): | 2.45 | |
| Repulse (5,40,3): | 0.0900 | |
| ROCnROLL: | -1 | |
| TRIX (15,9): | -0.0900 | |
| Courbe Coppock: | 0.96 |
| MA7: | 1,554.10 | |
| MA20: | 1,653.70 | |
| MA50: | 1,661.80 | |
| MA100: | 1,552.65 | |
| MAexp7: | 1,525.25 | |
| MAexp20: | 1,529.89 | |
| MAexp50: | 1,556.65 | |
| MAexp100: | 1,600.94 | |
| Price / MA7: | -1.63% | |
| Price / MA20: | -7.55% | |
| Price / MA50: | -8.01% | |
| Price / MA100: | -1.54% | |
| Price / MAexp7: | +0.23% | |
| Price / MAexp20: | -0.07% | |
| Price / MAexp50: | -1.79% | |
| Price / MAexp100: | -4.51% |
News
The latest news and videos published on MERCADOLIBRE INC. at the time of the analysis were as follows:
- Thinking about buying stock in MercadoLibre, Synopsys, ESGL Holdings, Soluna Holdings, or SenesTech?
- Thinking about trading options or stock in MercadoLibre, Tesla, Visa, Microsoft, or Bank of America?
- Thinking about buying stock in Party City, Lucid Group, AMC Entertainment, Delta Air Lines, or MercadoLibre?
- Thinking about trading options or stock in Unity Software, AstraZeneca, Amazon, MercadoLibre, or ASML Holding?
- Thinking about trading options or stock in Block, Mercadolibre, Futu, GameStop, or Regeneron Pharmaceuticals?
About author
Online


Add a comment
Comments
0 comments on the analysis MERCADOLIBRE INC. - 1H