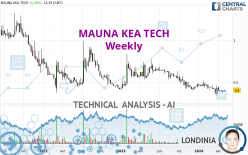
MAUNA KEA TECH - Weekly - Technical analysis published on 05/03/2024 (GMT)
- 61
- 0
- Timeframe : Weekly
- - Analysis generated on
- Status : IN PROGRESS...

Only Londinia subscribers can view the key levels of this analysis. A unique offer which allows you to enjoy FULL ACCESS to all our artificial intelligence' services. Discover Londinia...
Summary of the analysis
Trends
Short term:
Strongly bearish
Underlying:
Strongly bearish
Technical indicators
28%
44%
28%
My opinion
Bearish under
My targets
()
()
My analysis
The bearish trend is currently very strong for MAUNA KEA TECH. As long as the price remains below the resistance at , you could try to take advantage of the bearish rally. The first bearish objective is located at . The bearish momentum would be revived by a break in this support. Sellers would then use the next support located at as an objective. Crossing it would then enable sellers to target . Be careful, given the powerful bearish rally underway, excesses could lead to a short-term rebound. If this is the case, remember that trading against the trend may be riskier. It would seem more appropriate to wait for a signal indicating reversal of the trend.
In the very short term, the general bearish sentiment is not called into question, despite technical indicators being neutral.
Force
0
10
6.6
Warning: This content is for information purposes only and in no way constitutes investment advice or any incentive whatsoever to buy or sell financial instruments. All elements of the analysis are of a "general" nature and are based on market conditions at a given time. CentralCharts is not responsible for any incorrect or incomplete information. Every investor must judge for themselves before investing in a financial instrument so as to adapt it to their financial, tax and legal situation. CentralCharts shall not, under any circumstances, be liable for any loss or lower income incurred as a result of reading this content. Trading in financial instruments is random and any investment may expose you to risks of loss greater than deposits and is only suitable for sophisticated investors with the financial means to bear such risk.

This analysis was given by pierrott. Take part yourself by sharing additional analysis on another time unit:
Additional analysis
Quotes
MAUNA KEA TECH rating 0.4000 EUR. Over 5 days, this instrument gained +2.56% and was traded between 0.3845 EUR and 0.4055 EUR over the period. The price is currently at +4.03% from its lowest point and -1.36% from its highest point.0.3845
0.4055
0.4000
The Central Gaps scanner detects a bullish opening. A small advantage for buyers in the very short term.
Bullish opening
Type : Bullish
Timeframe : Openning
So that you have an overall view of the price change, here is a table showing the variations over several periods:
Near a new HIGH record (1 month)
Type : Bullish
Timeframe : Weekly
Technical
Technical analysis of MAUNA KEA TECH in Weekly shows a overall strongly bearish trend. The signals given by moving averages are 92.86% bearish. This strong bearish trend is confirmed by the strong signals currently being given by short-term moving averages. The Central Indicators market scanner currently does not detect any result that concerns moving averages.
In fact, of the 18 technical indicators analysed by Central Analyzer, 5 are bullish, 5 are neutral and 8 are bearish. Central Indicators, the detector scanner for these technical indicators has recently detected several signals:
MACD crosses UP its Moving Average
Type : Bullish
Timeframe : Weekly
Price is back over the pivot point
Type : Bullish
Timeframe : Weekly
An analysis of the price chart with the Central Patterns scanner (detector of chart patterns and resistances and supports) shows a result that can have an impact on the price change:
Near horizontal resistance
Type : Bearish
Timeframe : Weekly
The Central Candlesticks scanner which studies Japanese candlesticks did not detect anything.
ProTrendLines
R1
R2
R3
Price
| Price | R1 | R2 | R3 | |
|---|---|---|---|---|
| ProTrendLines | 0.4000 | 0.4090 | 0.7327 | 1.0156 |
| Change (%) | - | +2.25% | +83.18% | +153.90% |
| Change | - | +0.0090 | +0.3327 | +0.6156 |
| Level | - | Minor | Minor | Minor |
To determine price objectives, it is also possible to use the pivot points. Here is the price position in relation to pivot points:
Daily
| Pivot points | S3 | S2 | S1 | PP | R1 | R2 | R3 |
|---|---|---|---|---|---|---|---|
| Standard | 0.3857 | 0.3908 | 0.3947 | 0.3998 | 0.4037 | 0.4088 | 0.4127 |
| Camarilla | 0.3960 | 0.3969 | 0.3977 | 0.3985 | 0.3993 | 0.4002 | 0.4010 |
| Woodie | 0.3850 | 0.3905 | 0.3940 | 0.3995 | 0.4030 | 0.4085 | 0.4120 |
| Fibonacci | 0.3908 | 0.3943 | 0.3964 | 0.3998 | 0.4033 | 0.4054 | 0.4088 |
Weekly
| Pivot points | S3 | S2 | S1 | PP | R1 | R2 | R3 |
|---|---|---|---|---|---|---|---|
| Standard | 0.3383 | 0.3567 | 0.3733 | 0.3917 | 0.4083 | 0.4267 | 0.4433 |
| Camarilla | 0.3804 | 0.3836 | 0.3868 | 0.3900 | 0.3932 | 0.3964 | 0.3996 |
| Woodie | 0.3375 | 0.3563 | 0.3725 | 0.3913 | 0.4075 | 0.4263 | 0.4425 |
| Fibonacci | 0.3567 | 0.3700 | 0.3783 | 0.3917 | 0.4050 | 0.4133 | 0.4267 |
Monthly
| Pivot points | S3 | S2 | S1 | PP | R1 | R2 | R3 |
|---|---|---|---|---|---|---|---|
| Standard | 0.3090 | 0.3420 | 0.3720 | 0.4050 | 0.4350 | 0.4680 | 0.4980 |
| Camarilla | 0.3847 | 0.3905 | 0.3962 | 0.4020 | 0.4078 | 0.4136 | 0.4193 |
| Woodie | 0.3075 | 0.3413 | 0.3705 | 0.4043 | 0.4335 | 0.4673 | 0.4965 |
| Fibonacci | 0.3420 | 0.3661 | 0.3809 | 0.4050 | 0.4291 | 0.4439 | 0.4680 |
Numerical data
The following are the details of the technical indicators and moving averages that were collected to generate this technical analysis:
Technical indicators
Moving averages
| RSI (14): | 41.07 | |
| MACD (12,26,9): | -0.0293 | |
| Directional Movement: | -4.6863 | |
| AROON (14): | -64.2857 | |
| DEMA (21): | 0.3876 | |
| Parabolic SAR (0,02-0,02-0,2): | 0.4827 | |
| Elder Ray (13): | -0.0183 | |
| Super Trend (3,10): | 0.5064 | |
| Zig ZAG (10): | 0.4000 | |
| VORTEX (21): | 0.9780 | |
| Stochastique (14,3,5): | 31.28 | |
| TEMA (21): | 0.3861 | |
| Williams %R (14): | -61.13 | |
| Chande Momentum Oscillator (20): | -0.0700 | |
| Repulse (5,40,3): | 0.4523 | |
| ROCnROLL: | 2 | |
| TRIX (15,9): | -0.9234 | |
| Courbe Coppock: | 24.47 |
| MA7: | 0.3911 | |
| MA20: | 0.3935 | |
| MA50: | 0.4063 | |
| MA100: | 0.4307 | |
| MAexp7: | 0.4016 | |
| MAexp20: | 0.4280 | |
| MAexp50: | 0.4838 | |
| MAexp100: | 0.5720 | |
| Price / MA7: | +2.28% | |
| Price / MA20: | +1.65% | |
| Price / MA50: | -1.55% | |
| Price / MA100: | -7.13% | |
| Price / MAexp7: | -0.40% | |
| Price / MAexp20: | -6.54% | |
| Price / MAexp50: | -17.32% | |
| Price / MAexp100: | -30.07% |
Quotes :
-
15 min delayed data
-
Euronext Paris
News
Don't forget to follow the news on MAUNA KEA TECH. At the time of publication of this analysis, the latest news was as follows:
- Mauna Kea Technologies Announces the Transfer of its Shares on the Euronext Growth Paris Market Will Be Effective August 8, 2023
- Mauna Kea Technologies: Monthly information regarding the total number of voting rights and shares comprising the share capital
- Mauna Kea Technologies Reports Second Quarter and First Half 2023 Revenue
- Mauna Kea Technologies: Monthly Information Regarding the Total Number of Voting Rights and Shares Comprising the Share Capital
- Mauna Kea Technologies Announces the Installation of Cellvizio® at University College Cork - APC Microbiome Ireland for Inflammatory Bowel Disease (IBD) Applications
This member declared not having a position on this financial instrument or a related financial instrument.
About author

Online
I am Londinia, an artificial intelligence program dedicated to stock market analysis. I am able to analyse and interpret graphical and market data. Learn more…


Add a comment
Comments
0 comments on the analysis MAUNA KEA TECH - Weekly