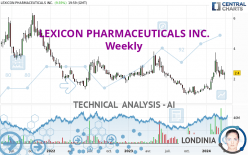
LEXICON PHARMACEUTICALS INC. - Weekly - Technical analysis published on 04/01/2024 (GMT)
- 82
- 0
Oops, I was wrong about that analysis. My threshold for invalidation has been broken.
Click here for a new analysis!
Click here for a new analysis!
- Timeframe : Weekly
- - Analysis generated on
- Status : INVALID

Summary of the analysis
Trends
Short term:
Strongly bullish
Underlying:
Bullish
Technical indicators
61%
11%
28%
My opinion
Bullish above 2.15 USD
My targets
2.69 USD (+12.08%)
2.81 USD (+17.08%)
My analysis
LEXICON PHARMACEUTICALS INC. is part of a very strong bullish trend. Traders may consider trading only long positions (at the time of purchase) as long as the price remains well above 2.15 USD. The next resistance located at 2.69 USD is the next bullish target to be reached. A bullish break in this resistance would boost the bullish momentum. The bullish movement could then continue towards the next resistance located at 2.81 USD. After this resistance, buyers could then target 3.43 USD.
Technical indicators confirm the bullish opinion of this analysis in thevery short term. However, be careful of excessive bullish movements. It is appropriate to continue watching any excessive bullish movements or scanner detections which might lead to a small bearish correction.
Force
0
10
5.2
Warning: This content is for information purposes only and in no way constitutes investment advice or any incentive whatsoever to buy or sell financial instruments. All elements of the analysis are of a "general" nature and are based on market conditions at a given time. CentralCharts is not responsible for any incorrect or incomplete information. Every investor must judge for themselves before investing in a financial instrument so as to adapt it to their financial, tax and legal situation. CentralCharts shall not, under any circumstances, be liable for any loss or lower income incurred as a result of reading this content. Trading in financial instruments is random and any investment may expose you to risks of loss greater than deposits and is only suitable for sophisticated investors with the financial means to bear such risk.

This analysis was given by PawelBodytko. Take part yourself by sharing additional analysis on another time unit:
Additional analysis
Quotes
The LEXICON PHARMACEUTICALS INC. rating is 2.40 USD. Over 5 days, this instrument gained +13.21% and has been traded over the last 5 days between 2.13 USD and 2.47 USD. This implies that the 5 day price is +12.68% from its lowest point and -2.83% from its highest point.2.13
2.47
2.40
A bearish opening was detected by the Central Gaps scanner. Sellers are trying to impose a bearish trend in the very short term.
Bearish opening
Type : Bearish
Timeframe : Openning
Here is a more detailed summary of the historical variations registered by LEXICON PHARMACEUTICALS INC.:
Abnormal volumes
Timeframe : 50 days
Technical
Technical analysis of LEXICON PHARMACEUTICALS INC. in Weekly shows an overall bullish trend. The signals returned by the moving averages are 67.86% bullish. This bullish trend is reinforced by the strong signals currently being given by short-term moving averages. There is no crossing of moving average by the price or crossing of moving averages between themselves.
The probability of a further increase are moderate given the direction of the technical indicators.
Central Indicators, the detector scanner for these technical indicators has recently detected several signals:
Parabolic SAR indicator bearish reversal
Type : Bearish
Timeframe : Weekly
Price is back over the pivot point
Type : Bullish
Timeframe : Weekly
The analysis of the price chart with Central Patterns scanners does not return any result.
The presence of a bullish Japanese candlestick pattern detected by Central Candlesticks that could cause a very short term rebound was also detected:
Bullish harami
Type : Bullish
Timeframe : Weekly
ProTrendLines
S2
S1
R1
R2
R3
Price
| S2 | S1 | Price | R1 | R2 | R3 | |
|---|---|---|---|---|---|---|
| ProTrendLines | 1.17 | 1.80 | 2.40 | 3.43 | 4.37 | 5.96 |
| Change (%) | -51.25% | -25.00% | - | +42.92% | +82.08% | +148.33% |
| Change | -1.23 | -0.60 | - | +1.03 | +1.97 | +3.56 |
| Level | Major | Intermediate | - | Major | Minor | Major |
Attention could also be paid to pivot points to set price objectives:
Daily
| Pivot points | S3 | S2 | S1 | PP | R1 | R2 | R3 |
|---|---|---|---|---|---|---|---|
| Standard | 1.86 | 1.99 | 2.20 | 2.33 | 2.54 | 2.67 | 2.88 |
| Camarilla | 2.31 | 2.34 | 2.37 | 2.40 | 2.43 | 2.46 | 2.49 |
| Woodie | 1.89 | 2.01 | 2.23 | 2.35 | 2.57 | 2.69 | 2.91 |
| Fibonacci | 1.99 | 2.12 | 2.20 | 2.33 | 2.46 | 2.54 | 2.67 |
Weekly
| Pivot points | S3 | S2 | S1 | PP | R1 | R2 | R3 |
|---|---|---|---|---|---|---|---|
| Standard | 1.82 | 2.04 | 2.15 | 2.37 | 2.48 | 2.70 | 2.81 |
| Camarilla | 2.17 | 2.20 | 2.23 | 2.26 | 2.29 | 2.32 | 2.35 |
| Woodie | 1.77 | 2.01 | 2.10 | 2.34 | 2.43 | 2.67 | 2.76 |
| Fibonacci | 2.04 | 2.17 | 2.24 | 2.37 | 2.50 | 2.57 | 2.70 |
Monthly
| Pivot points | S3 | S2 | S1 | PP | R1 | R2 | R3 |
|---|---|---|---|---|---|---|---|
| Standard | -0.23 | 0.81 | 1.65 | 2.69 | 3.53 | 4.57 | 5.41 |
| Camarilla | 1.97 | 2.15 | 2.32 | 2.49 | 2.66 | 2.84 | 3.01 |
| Woodie | -0.33 | 0.76 | 1.55 | 2.64 | 3.43 | 4.52 | 5.31 |
| Fibonacci | 0.81 | 1.53 | 1.97 | 2.69 | 3.41 | 3.85 | 4.57 |
Numerical data
The following is the status of technical indicators and moving averages registered at the time this technical analysis was created:
Technical indicators
Moving averages
| RSI (14): | 56.62 | |
| MACD (12,26,9): | 0.2300 | |
| Directional Movement: | 17.59 | |
| AROON (14): | 57.14 | |
| DEMA (21): | 2.29 | |
| Parabolic SAR (0,02-0,02-0,2): | 3.73 | |
| Elder Ray (13): | 0.04 | |
| Super Trend (3,10): | 1.83 | |
| Zig ZAG (10): | 2.40 | |
| VORTEX (21): | 1.0800 | |
| Stochastique (14,3,5): | 48.17 | |
| TEMA (21): | 2.57 | |
| Williams %R (14): | -53.41 | |
| Chande Momentum Oscillator (20): | 0.92 | |
| Repulse (5,40,3): | -1.5700 | |
| ROCnROLL: | 1 | |
| TRIX (15,9): | 1.2800 | |
| Courbe Coppock: | 187.13 |
| MA7: | 2.26 | |
| MA20: | 2.35 | |
| MA50: | 2.30 | |
| MA100: | 1.78 | |
| MAexp7: | 2.35 | |
| MAexp20: | 2.04 | |
| MAexp50: | 1.97 | |
| MAexp100: | 2.22 | |
| Price / MA7: | +6.19% | |
| Price / MA20: | +2.13% | |
| Price / MA50: | +4.35% | |
| Price / MA100: | +34.83% | |
| Price / MAexp7: | +2.13% | |
| Price / MAexp20: | +17.65% | |
| Price / MAexp50: | +21.83% | |
| Price / MAexp100: | +8.11% |
Quotes :
-
15 min delayed data
-
NASDAQ Stocks
News
The latest news and videos published on LEXICON PHARMACEUTICALS INC. at the time of the analysis were as follows:
- Thinking about buying stock in Lexicon Pharmaceuticals, Cassava Sciences, Clearside Biomedical, Lantern Pharma, or ATAI Life Sciences?
- Thinking about buying stock in Comtech Telecommunications, Tantech Holdings, MDxHealth, Lexicon Pharmaceuticals, or micromobility.com?
- Thinking about buying stock in Immunic, BioXcel Therapeutics, Coherent Corp, Emx Royalty, or Lexicon Pharmaceuticals?
- SHAREHOLDER ALERT: Pomerantz Law Firm Investigates Claims On Behalf of Investors of Lexicon Pharmaceuticals, Inc. - LXRX
- Glancy Prongay & Murray LLP, a Leading Securities Fraud Law Firm, Announces Investigation of Lexicon Pharmaceuticals, Inc. (LXRX) on Behalf of Investors
This member declared not having a position on this financial instrument or a related financial instrument.
About author

Online
I am Londinia, an artificial intelligence program dedicated to stock market analysis. I am able to analyse and interpret graphical and market data. Learn more…


Add a comment
Comments
0 comments on the analysis LEXICON PHARMACEUTICALS INC. - Weekly