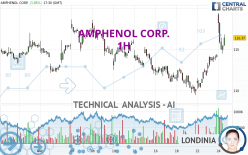
AMPHENOL CORP. - 1H - Technical analysis published on 04/24/2024 (GMT)
- 86
- 0
Click here for a new analysis!
- Timeframe : 1H
- - Analysis generated on
- Status : TARGET REACHED

Summary of the analysis

Additional analysis
Quotes
The AMPHENOL CORP. price is 116.63 USD. The price registered an increase of +2.07% on the session and was between 114.49 USD and 119.39 USD. This implies that the price is at +1.87% from its lowest and at -2.31% from its highest.The Central Gaps scanner detects the formation of a bullish gap marking the strong presence of buyers against sellers at the opening. This formed a quotation gap.
Opening Gap UP
Type : Bullish
Timeframe : Openning
So that you have an overall view of the price change, here is a table showing the variations over several periods:
Near a new HIGH record (5 years)
Type : Bullish
Timeframe : Weekly
Near a new HIGH record (1 year)
Type : Bullish
Timeframe : Weekly
Near a new HIGH record (1st january)
Type : Bullish
Timeframe : Weekly
Near a new LOW record (1 month)
Type : Bearish
Timeframe : Weekly
Technical
A technical analysis in 1H of this AMPHENOL CORP. chart shows a bullish trend. 71.43% of the signals given by moving averages are bullish. The overall trend is reinforced by the strong bullish signals from short-term moving averages. There is no crossing of moving average by the price or crossing of moving averages between themselves.
In fact, 13 technical indicators on 18 studied are currently bullish. Caution: the Central Indicators scanner currently detects an excess:
CCI indicator is overbought : over 100
Type : Neutral
Timeframe : 1 hour
Pivot points : price is over resistance 1
Type : Neutral
Timeframe : Weekly
Pivot points : price is over resistance 2
Type : Neutral
Timeframe : 1 hour
Central Patterns, the market scanner focusing on chart patterns, resistances and supports found these results:
Near horizontal resistance
Type : Bearish
Timeframe : 1 hour
Resistance of channel is broken
Type : Bullish
Timeframe : 1 hour
For a small rebound in the very short term, the Central Candlesticks scanner currently notes the presence of this bullish pattern in Japanese candlesticks:
White morning star
Type : Bullish
Timeframe : 1 hour
| S3 | S2 | S1 | Price | R1 | R2 | R3 | |
|---|---|---|---|---|---|---|---|
| ProTrendLines | 114.20 | 115.24 | 116.15 | 116.63 | 117.38 | 118.60 | 119.59 |
| Change (%) | -2.08% | -1.19% | -0.41% | - | +0.64% | +1.69% | +2.54% |
| Change | -2.43 | -1.39 | -0.48 | - | +0.75 | +1.97 | +2.96 |
| Level | Intermediate | Minor | Minor | - | Minor | Major | Intermediate |
Attention could also be paid to pivot points to set price objectives:
| Pivot points | S3 | S2 | S1 | PP | R1 | R2 | R3 |
|---|---|---|---|---|---|---|---|
| Standard | 110.46 | 111.29 | 112.78 | 113.61 | 115.10 | 115.93 | 117.42 |
| Camarilla | 113.62 | 113.84 | 114.05 | 114.26 | 114.47 | 114.69 | 114.90 |
| Woodie | 110.78 | 111.46 | 113.10 | 113.78 | 115.42 | 116.10 | 117.74 |
| Fibonacci | 111.29 | 112.18 | 112.73 | 113.61 | 114.50 | 115.05 | 115.93 |
| Pivot points | S3 | S2 | S1 | PP | R1 | R2 | R3 |
|---|---|---|---|---|---|---|---|
| Standard | 102.13 | 105.78 | 107.98 | 111.63 | 113.83 | 117.48 | 119.68 |
| Camarilla | 108.56 | 109.10 | 109.63 | 110.17 | 110.71 | 111.24 | 111.78 |
| Woodie | 101.40 | 105.42 | 107.25 | 111.27 | 113.10 | 117.12 | 118.95 |
| Fibonacci | 105.78 | 108.02 | 109.40 | 111.63 | 113.87 | 115.25 | 117.48 |
| Pivot points | S3 | S2 | S1 | PP | R1 | R2 | R3 |
|---|---|---|---|---|---|---|---|
| Standard | 97.96 | 103.14 | 109.24 | 114.42 | 120.52 | 125.70 | 131.80 |
| Camarilla | 112.25 | 113.28 | 114.32 | 115.35 | 116.38 | 117.42 | 118.45 |
| Woodie | 98.43 | 103.37 | 109.71 | 114.65 | 120.99 | 125.93 | 132.27 |
| Fibonacci | 103.14 | 107.45 | 110.11 | 114.42 | 118.73 | 121.39 | 125.70 |
Numerical data
The following is the status of the technical indicators and moving averages at the time of publication of this technical analysis:
| RSI (14): | 63.17 | |
| MACD (12,26,9): | 1.1300 | |
| Directional Movement: | 21.84 | |
| AROON (14): | 71.43 | |
| DEMA (21): | 115.29 | |
| Parabolic SAR (0,02-0,02-0,2): | 119.29 | |
| Elder Ray (13): | 1.29 | |
| Super Trend (3,10): | 114.64 | |
| Zig ZAG (10): | 116.44 | |
| VORTEX (21): | 1.0900 | |
| Stochastique (14,3,5): | 53.96 | |
| TEMA (21): | 116.41 | |
| Williams %R (14): | -36.14 | |
| Chande Momentum Oscillator (20): | 4.73 | |
| Repulse (5,40,3): | 0.6300 | |
| ROCnROLL: | 1 | |
| TRIX (15,9): | 0.1000 | |
| Courbe Coppock: | 7.50 |
| MA7: | 112.55 | |
| MA20: | 114.05 | |
| MA50: | 111.10 | |
| MA100: | 104.44 | |
| MAexp7: | 115.53 | |
| MAexp20: | 114.02 | |
| MAexp50: | 113.25 | |
| MAexp100: | 113.34 | |
| Price / MA7: | +3.63% | |
| Price / MA20: | +2.26% | |
| Price / MA50: | +4.98% | |
| Price / MA100: | +11.67% | |
| Price / MAexp7: | +0.95% | |
| Price / MAexp20: | +2.29% | |
| Price / MAexp50: | +2.98% | |
| Price / MAexp100: | +2.90% |
News
The latest news and videos published on AMPHENOL CORP. at the time of the analysis were as follows:
- Shareholder Alert: Ademi LLP investigates whether PCTEL, Inc. has obtained a Fair Price in its transaction with Amphenol
- Amphenol Announces Third Quarter 2023 Dividend
- Amphenol Reports Second Quarter 2023 Results
- Amphenol Announces Second Quarter 2023 Dividend
- Amphenol Reports First Quarter 2023 Results
About author
Online


Add a comment
Comments
0 comments on the analysis AMPHENOL CORP. - 1H