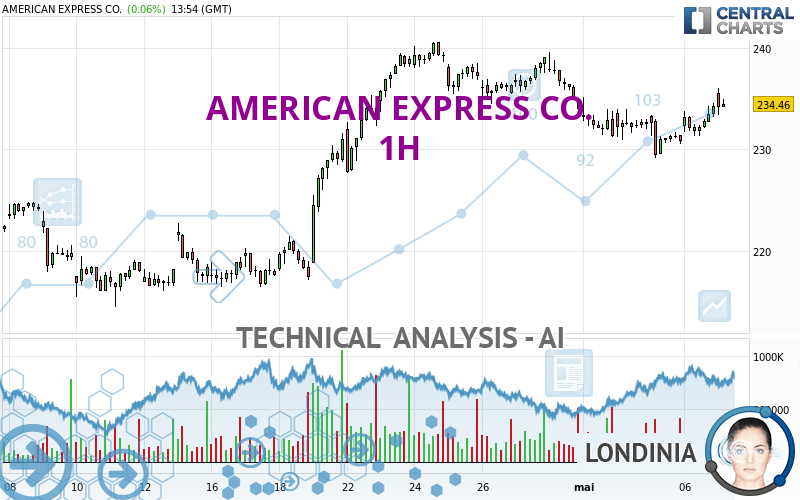
AMERICAN EXPRESS CO. - 1H - Technical analysis published on 05/07/2024 (GMT)
- 81
- 0
Click here for a new analysis!
- Timeframe : 1H
- - Analysis generated on
- Status : LEVEL MAINTAINED
Summary of the analysis

Additional analysis
Quotes
The AMERICAN EXPRESS CO. price is 234.24 USD. The price registered a decrease of -0.04% on the session with the lowest point at 233.41 USD and the highest point at 236.00 USD. The deviation from the price is +0.36% for the low point and -0.75% for the high point.The Central Gaps scanner detects a bullish gap which is a sign that buyers have taken the lead in the very short term.
Opening Gap UP
Type : Bullish
Timeframe : Openning
So that you have an overall view of the price change, here is a table showing the variations over several periods:
Near a new HIGH record (5 years)
Type : Bullish
Timeframe : Weekly
Near a new HIGH record (1 year)
Type : Bullish
Timeframe : Weekly
Near a new HIGH record (1st january)
Type : Bullish
Timeframe : Weekly
Near a new HIGH record (1 month)
Type : Bullish
Timeframe : Weekly
Technical
Technical analysis of this 1H chart of AMERICAN EXPRESS CO. indicates that the overall trend is bullish. The signals returned by the moving averages are 78.57% bullish. This bullish trend is reinforced by the strong signals currently being given by short-term moving averages. The Central Indicators scanner detects bearish signals on moving averages that could impact this trend:
Bearish price crossover with Moving Average 50
Type : Bearish
Timeframe : 1 hour
Bearish price crossover with adaptative moving average 50
Type : Bearish
Timeframe : 1 hour
The probability of a further increase is high given the direction of the technical indicators.
Caution: the Central Indicators scanner currently detects an excess:
CCI indicator is overbought : over 100
Type : Neutral
Timeframe : 1 hour
Williams %R indicator is overbought : over -20
Type : Neutral
Timeframe : 1 hour
Ichimoku : price is over the cloud
Type : Bullish
Timeframe : 1 hour
MACD indicator is back over 0
Type : Bullish
Timeframe : 1 hour
Price is back over the pivot point
Type : Bullish
Timeframe : Weekly
An analysis of the price chart with the Central Patterns scanner (detector of chart patterns and resistances and supports) shows several results that can have an impact on the price change:
Near horizontal resistance
Type : Bearish
Timeframe : 1 hour
Near resistance of channel
Type : Bearish
Timeframe : 1 hour
Central Candlesticks, the scanner specialised in Japanese candlesticks, detects a bearish signal that could support the hypothesis of a small drop in the very short term:
Dark cloud cover
Type : Bearish
Timeframe : 1 hour
| S3 | S2 | S1 | Price | R1 | R2 | |
|---|---|---|---|---|---|---|
| ProTrendLines | 217.64 | 222.73 | 229.68 | 234.24 | 234.42 | 239.12 |
| Change (%) | -7.09% | -4.91% | -1.95% | - | +0.08% | +2.08% |
| Change | -16.60 | -11.51 | -4.56 | - | +0.18 | +4.88 |
| Level | Major | Intermediate | Intermediate | - | Minor | Major |
Attention could also be paid to pivot points to set price objectives:
| Pivot points | S3 | S2 | S1 | PP | R1 | R2 | R3 |
|---|---|---|---|---|---|---|---|
| Standard | 228.99 | 230.16 | 232.24 | 233.41 | 235.49 | 236.66 | 238.74 |
| Camarilla | 233.44 | 233.73 | 234.03 | 234.33 | 234.63 | 234.93 | 235.22 |
| Woodie | 229.46 | 230.39 | 232.71 | 233.64 | 235.96 | 236.89 | 239.21 |
| Fibonacci | 230.16 | 231.40 | 232.17 | 233.41 | 234.65 | 235.42 | 236.66 |
| Pivot points | S3 | S2 | S1 | PP | R1 | R2 | R3 |
|---|---|---|---|---|---|---|---|
| Standard | 216.25 | 222.69 | 226.73 | 233.17 | 237.21 | 243.65 | 247.69 |
| Camarilla | 227.89 | 228.85 | 229.81 | 230.77 | 231.73 | 232.69 | 233.65 |
| Woodie | 215.05 | 222.09 | 225.53 | 232.57 | 236.01 | 243.05 | 246.49 |
| Fibonacci | 222.69 | 226.69 | 229.17 | 233.17 | 237.17 | 239.65 | 243.65 |
| Pivot points | S3 | S2 | S1 | PP | R1 | R2 | R3 |
|---|---|---|---|---|---|---|---|
| Standard | 192.80 | 203.66 | 218.84 | 229.70 | 244.88 | 255.74 | 270.92 |
| Camarilla | 226.87 | 229.26 | 231.64 | 234.03 | 236.42 | 238.80 | 241.19 |
| Woodie | 194.97 | 204.74 | 221.01 | 230.78 | 247.05 | 256.82 | 273.09 |
| Fibonacci | 203.66 | 213.60 | 219.75 | 229.70 | 239.64 | 245.79 | 255.74 |
Numerical data
The following is the status of technical indicators and moving averages registered at the time this technical analysis was created:
| RSI (14): | 54.96 | |
| MACD (12,26,9): | -0.0800 | |
| Directional Movement: | 14.12 | |
| AROON (14): | 92.86 | |
| DEMA (21): | 232.30 | |
| Parabolic SAR (0,02-0,02-0,2): | 230.05 | |
| Elder Ray (13): | 2.01 | |
| Super Trend (3,10): | 235.06 | |
| Zig ZAG (10): | 233.81 | |
| VORTEX (21): | 1.0400 | |
| Stochastique (14,3,5): | 81.66 | |
| TEMA (21): | 232.87 | |
| Williams %R (14): | -32.17 | |
| Chande Momentum Oscillator (20): | 2.63 | |
| Repulse (5,40,3): | -0.6500 | |
| ROCnROLL: | 1 | |
| TRIX (15,9): | -0.0400 | |
| Courbe Coppock: | 0.86 |
| MA7: | 233.71 | |
| MA20: | 228.84 | |
| MA50: | 224.75 | |
| MA100: | 209.37 | |
| MAexp7: | 233.17 | |
| MAexp20: | 232.71 | |
| MAexp50: | 233.03 | |
| MAexp100: | 231.52 | |
| Price / MA7: | +0.23% | |
| Price / MA20: | +2.36% | |
| Price / MA50: | +4.22% | |
| Price / MA100: | +11.88% | |
| Price / MAexp7: | +0.46% | |
| Price / MAexp20: | +0.66% | |
| Price / MAexp50: | +0.52% | |
| Price / MAexp100: | +1.17% |
News
The last news published on AMERICAN EXPRESS CO. at the time of the generation of this analysis was as follows:
- HQ Announces Integration With American Express for an Enhanced Ride Payment Experience
- CLEAR AND AMERICAN EXPRESS RENEW PARTNERSHIP TO PROVIDE PREMIUM TRAVEL EXPERIENCES AT AIRPORTS TO CARD MEMBERS
- Evolve Bank & Trust Partners With Neon Money Club to Launch the Cream Card on the American Express Network
-
 Look ahead: UK and German consumer confidence; BOJ minutes; Core PCE; American Express
- Thinking about trading options or stock in MDC Holdings, Applied Digital, Toll Brothers, Netflix, or American Express?
About author
Online


Add a comment
Comments
0 comments on the analysis AMERICAN EXPRESS CO. - 1H