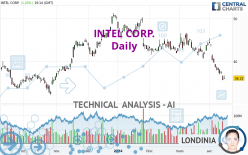
INTEL CORP. - Daily - Technical analysis published on 04/15/2024 (GMT)
- 131
- 0
Click here for a new analysis!
- Timeframe : Daily
- - Analysis generated on
- Status : TARGET REACHED

Summary of the analysis

Additional analysis
Quotes
INTEL CORP. rating 36.13 USD. The price registered an increase of +1.23% on the session and was between 35.89 USD and 36.70 USD. This implies that the price is at +0.67% from its lowest and at -1.55% from its highest.The Central Gaps scanner detects a bullish opening. A small advantage for buyers in the very short term.
Bullish opening
Type : Bullish
Timeframe : Openning
So that you have an overall view of the price change, here is a table showing the variations over several periods:
Near a new LOW record (1st january)
Type : Bearish
Timeframe : Weekly
Near a new LOW record (1 month)
Type : Bearish
Timeframe : Weekly
Technical
Technical analysis of INTEL CORP. in Daily shows a overall strongly bearish trend. 92.86% of the signals given by moving averages are bearish. This strongly bearish trend is supported by the strong bearish signals given by short-term moving averages. The Central Indicators scanner does not detect any result on moving averages that would impact this trend.
The technical indicators are generally neutral. They do not provide relevant information on the direction of future price movements.
Caution: the Central Indicators scanner currently detects an excess:
RSI indicator is oversold : under 30
Type : Neutral
Timeframe : Daily
CCI indicator is oversold : under -100
Type : Neutral
Timeframe : Daily
CCI indicator: bullish divergence
Type : Bullish
Timeframe : Daily
RSI indicator: bullish divergence
Type : Bullish
Timeframe : Daily
Williams %R indicator is oversold : under -80
Type : Neutral
Timeframe : Daily
The Central Patterns scanner, which studies chart patterns, resistances and supports, has identified these signals:
Near horizontal resistance
Type : Bearish
Timeframe : Daily
Near support of channel
Type : Bullish
Timeframe : Daily
For a small rebound in the very short term, the Central Candlesticks scanner currently notes the presence of this bullish pattern in Japanese candlesticks:
Bullish harami
Type : Bullish
Timeframe : Daily
| S3 | S2 | S1 | Price | R1 | R2 | R3 | |
|---|---|---|---|---|---|---|---|
| ProTrendLines | 24.16 | 27.13 | 32.41 | 36.13 | 36.55 | 39.93 | 41.96 |
| Change (%) | -33.13% | -24.91% | -10.30% | - | +1.16% | +10.52% | +16.14% |
| Change | -11.97 | -9.00 | -3.72 | - | +0.42 | +3.80 | +5.83 |
| Level | Major | Minor | Major | - | Minor | Major | Major |
To determine price objectives, it is also possible to use the pivot points. Here is the price position in relation to pivot points:
| Pivot points | S3 | S2 | S1 | PP | R1 | R2 | R3 |
|---|---|---|---|---|---|---|---|
| Standard | 34.19 | 34.90 | 35.29 | 36.00 | 36.39 | 37.10 | 37.49 |
| Camarilla | 35.39 | 35.49 | 35.59 | 35.69 | 35.79 | 35.89 | 35.99 |
| Woodie | 34.04 | 34.82 | 35.14 | 35.92 | 36.24 | 37.02 | 37.34 |
| Fibonacci | 34.90 | 35.32 | 35.58 | 36.00 | 36.42 | 36.68 | 37.10 |
| Pivot points | S3 | S2 | S1 | PP | R1 | R2 | R3 |
|---|---|---|---|---|---|---|---|
| Standard | 31.31 | 33.46 | 34.57 | 36.72 | 37.83 | 39.98 | 41.09 |
| Camarilla | 34.79 | 35.09 | 35.39 | 35.69 | 35.99 | 36.29 | 36.59 |
| Woodie | 30.80 | 33.20 | 34.06 | 36.46 | 37.32 | 39.72 | 40.58 |
| Fibonacci | 33.46 | 34.70 | 35.47 | 36.72 | 37.96 | 38.73 | 39.98 |
| Pivot points | S3 | S2 | S1 | PP | R1 | R2 | R3 |
|---|---|---|---|---|---|---|---|
| Standard | 34.89 | 37.73 | 40.95 | 43.79 | 47.01 | 49.85 | 53.07 |
| Camarilla | 42.50 | 43.06 | 43.62 | 44.17 | 44.73 | 45.28 | 45.84 |
| Woodie | 35.08 | 37.83 | 41.14 | 43.89 | 47.20 | 49.95 | 53.26 |
| Fibonacci | 37.73 | 40.05 | 41.48 | 43.79 | 46.11 | 47.54 | 49.85 |
Numerical data
The following is the status of the technical indicators and moving averages at the time of publication of this technical analysis:
| RSI (14): | 30.10 | |
| MACD (12,26,9): | -1.8500 | |
| Directional Movement: | -25.95 | |
| AROON (14): | -64.29 | |
| DEMA (21): | 37.81 | |
| Parabolic SAR (0,02-0,02-0,2): | 41.11 | |
| Elder Ray (13): | -2.63 | |
| Super Trend (3,10): | 40.29 | |
| Zig ZAG (10): | 36.10 | |
| VORTEX (21): | 0.7600 | |
| Stochastique (14,3,5): | 4.43 | |
| TEMA (21): | 36.62 | |
| Williams %R (14): | -95.06 | |
| Chande Momentum Oscillator (20): | -7.69 | |
| Repulse (5,40,3): | -3.8300 | |
| ROCnROLL: | 2 | |
| TRIX (15,9): | -0.4100 | |
| Courbe Coppock: | 23.99 |
| MA7: | 37.37 | |
| MA20: | 40.70 | |
| MA50: | 42.40 | |
| MA100: | 44.09 | |
| MAexp7: | 37.54 | |
| MAexp20: | 39.96 | |
| MAexp50: | 41.90 | |
| MAexp100: | 41.99 | |
| Price / MA7: | -3.32% | |
| Price / MA20: | -11.23% | |
| Price / MA50: | -14.79% | |
| Price / MA100: | -18.05% | |
| Price / MAexp7: | -3.76% | |
| Price / MAexp20: | -9.58% | |
| Price / MAexp50: | -13.77% | |
| Price / MAexp100: | -13.96% |
News
The latest news and videos published on INTEL CORP. at the time of the analysis were as follows:
-
 House Intel chair says ‘at this point’ U.S. should not be engaged in military action on Iran
-
‘At this point,’ U.S. shouldn’t engage in ‘military action at Iran,’ says GOP House Intel chair
- Infosys Topaz and Intel Collaborate to Accelerate Enterprise Growth and Efficiency with Generative AI
-
Will Microsoft, Intel and AMD be affected by China’s latest chip hurdle?
- Thinking about trading options or stock in NVIDIA, Amazon, Meta Platforms, Intel, or Walmart?
About author
Online


Add a comment
Comments
0 comments on the analysis INTEL CORP. - Daily