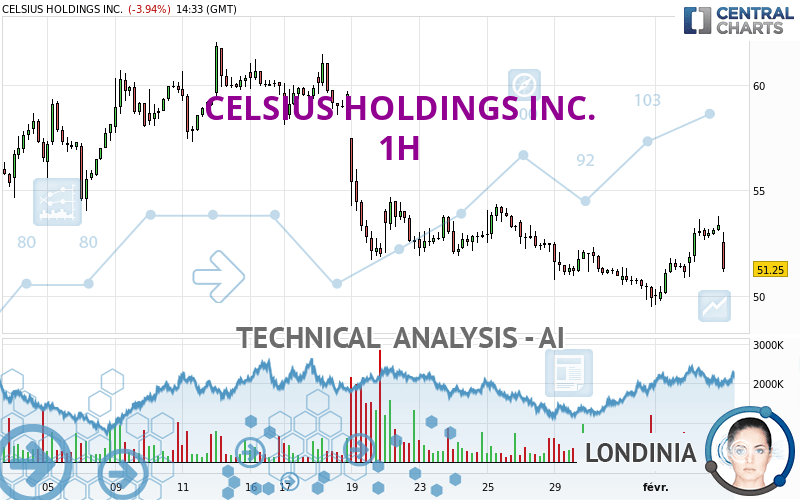
CELSIUS HOLDINGS INC. - 1H - Technical analysis published on 02/05/2024 (GMT)
- 86
- 0
Oops, I was wrong about that analysis. My threshold for invalidation has been broken.
Click here for a new analysis!
Click here for a new analysis!
- Timeframe : 1H
- - Analysis generated on
- Status : INVALID
Summary of the analysis
Trends
Short term:
Strongly bullish
Underlying:
Slightly bullish
Technical indicators
78%
0%
22%
My opinion
Bullish above 51.72 USD
My targets
53.03 USD (+1.45%)
54.02 USD (+3.35%)
My analysis
CELSIUS HOLDINGS INC. is currently trying to strengthen its basic trend with a very bullish short term. As long as the price remains above 51.72 USD, traders may consider taking advantage of this bullish acceleration and setting themselves to trade only long positions (at the time of purchase). Buyers will encounter the resistance at 53.03 USD. A bullish break in this resistance would confirm a continuation of the bullish acceleration. The next resistance located at 54.02 USD would then be the next bullish objective for buyers. Crossing it would then enable buyers to target 58.15 USD. Beware of a possible return to under the support located at 51.72 USD which would be the sign of a correction of the bullish excesses registered in the short term.
In the very short term, the general bullish sentiment is confirmed by technical indicators. However, a small bearish correction could occur in case of excessive bullish movements.
Force
0
10
4.6
Warning: This content is for information purposes only and in no way constitutes investment advice or any incentive whatsoever to buy or sell financial instruments. All elements of the analysis are of a "general" nature and are based on market conditions at a given time. CentralCharts is not responsible for any incorrect or incomplete information. Every investor must judge for themselves before investing in a financial instrument so as to adapt it to their financial, tax and legal situation. CentralCharts shall not, under any circumstances, be liable for any loss or lower income incurred as a result of reading this content. Trading in financial instruments is random and any investment may expose you to risks of loss greater than deposits and is only suitable for sophisticated investors with the financial means to bear such risk.

This analysis was given by ppires. Take part yourself by sharing additional analysis on another time unit:
Additional analysis
Quotes
CELSIUS HOLDINGS INC. rating 52.27 USD. On the day, this instrument lost -2.02% and was traded between 52.09 USD and 53.00 USD over the period. The price is currently at +0.35% from its lowest and -1.38% from its highest.52.09
53.00
52.27
A bearish opening was detected by the Central Gaps scanner. Sellers are trying to impose a bearish trend in the very short term.
Bearish opening
Type : Bearish
Timeframe : Openning
Here is a more detailed summary of the historical variations registered by CELSIUS HOLDINGS INC.:
Near a new LOW record (1st january)
Type : Bearish
Timeframe : Weekly
Near a new LOW record (1 month)
Type : Bearish
Timeframe : Weekly
Technical
Technical analysis of CELSIUS HOLDINGS INC. in 1H shows an overall slightly bullish trend. 53.57% of the signals given by moving averages are bullish. The overall trend could accelerate as strong bullish signals from short-term moving averages are expected. The Central Indicators market scanner currently does not detect any result that concerns moving averages.
In fact, 14 technical indicators on 18 studied are currently positioned bullish. Caution: the Central Indicators scanner currently detects an excess:
CCI indicator is overbought : over 100
Type : Neutral
Timeframe : 1 hour
Williams %R indicator is overbought : over -20
Type : Neutral
Timeframe : 1 hour
Pivot points : price is over resistance 2
Type : Neutral
Timeframe : 1 hour
Price is back over the pivot point
Type : Bullish
Timeframe : Weekly
Central Patterns, the scanner specializing in chart patterns, did not identify any signals.
The Central Candlesticks scanner, specialised in Japanese candlesticks, did not identify any signals.
ProTrendLines
S3
S2
S1
R1
R2
R3
Price
| S3 | S2 | S1 | Price | R1 | R2 | R3 | |
|---|---|---|---|---|---|---|---|
| ProTrendLines | 41.52 | 49.09 | 51.72 | 52.27 | 53.03 | 54.02 | 58.15 |
| Change (%) | -20.57% | -6.08% | -1.05% | - | +1.45% | +3.35% | +11.25% |
| Change | -10.75 | -3.18 | -0.55 | - | +0.76 | +1.75 | +5.88 |
| Level | Minor | Major | Intermediate | - | Minor | Minor | Minor |
Attention could also be paid to pivot points to set price objectives:
Daily
| Pivot points | S3 | S2 | S1 | PP | R1 | R2 | R3 |
|---|---|---|---|---|---|---|---|
| Standard | 48.68 | 49.79 | 51.57 | 52.68 | 54.46 | 55.57 | 57.35 |
| Camarilla | 52.56 | 52.82 | 53.09 | 53.35 | 53.62 | 53.88 | 54.15 |
| Woodie | 49.02 | 49.96 | 51.91 | 52.85 | 54.80 | 55.74 | 57.69 |
| Fibonacci | 49.79 | 50.89 | 51.58 | 52.68 | 53.78 | 54.47 | 55.57 |
Weekly
| Pivot points | S3 | S2 | S1 | PP | R1 | R2 | R3 |
|---|---|---|---|---|---|---|---|
| Standard | 46.28 | 47.87 | 50.61 | 52.20 | 54.94 | 56.53 | 59.27 |
| Camarilla | 52.16 | 52.56 | 52.95 | 53.35 | 53.75 | 54.14 | 54.54 |
| Woodie | 46.86 | 48.16 | 51.19 | 52.49 | 55.52 | 56.82 | 59.85 |
| Fibonacci | 47.87 | 49.52 | 50.55 | 52.20 | 53.85 | 54.88 | 56.53 |
Monthly
| Pivot points | S3 | S2 | S1 | PP | R1 | R2 | R3 |
|---|---|---|---|---|---|---|---|
| Standard | 32.97 | 41.21 | 45.56 | 53.80 | 58.15 | 66.39 | 70.74 |
| Camarilla | 46.44 | 47.59 | 48.75 | 49.90 | 51.05 | 52.21 | 53.36 |
| Woodie | 31.02 | 40.24 | 43.61 | 52.83 | 56.20 | 65.42 | 68.79 |
| Fibonacci | 41.21 | 46.02 | 48.99 | 53.80 | 58.61 | 61.58 | 66.39 |
Numerical data
The following is the status of technical indicators and moving averages registered at the time this technical analysis was created:
Technical indicators
Moving averages
| RSI (14): | 68.00 | |
| MACD (12,26,9): | 0.4200 | |
| Directional Movement: | 16.13 | |
| AROON (14): | 100.00 | |
| DEMA (21): | 52.40 | |
| Parabolic SAR (0,02-0,02-0,2): | 50.99 | |
| Elder Ray (13): | 1.13 | |
| Super Trend (3,10): | 51.34 | |
| Zig ZAG (10): | 53.35 | |
| VORTEX (21): | 1.1400 | |
| Stochastique (14,3,5): | 87.10 | |
| TEMA (21): | 53.10 | |
| Williams %R (14): | -10.40 | |
| Chande Momentum Oscillator (20): | 3.18 | |
| Repulse (5,40,3): | 0.7600 | |
| ROCnROLL: | 1 | |
| TRIX (15,9): | 0.0300 | |
| Courbe Coppock: | 9.11 |
| MA7: | 51.87 | |
| MA20: | 55.29 | |
| MA50: | 53.44 | |
| MA100: | 54.96 | |
| MAexp7: | 52.78 | |
| MAexp20: | 52.02 | |
| MAexp50: | 52.24 | |
| MAexp100: | 53.24 | |
| Price / MA7: | +0.77% | |
| Price / MA20: | -5.46% | |
| Price / MA50: | -2.19% | |
| Price / MA100: | -4.89% | |
| Price / MAexp7: | -0.97% | |
| Price / MAexp20: | +0.48% | |
| Price / MAexp50: | +0.06% | |
| Price / MAexp100: | -1.82% |
Quotes :
-
15 min delayed data
-
NASDAQ Stocks
News
The last news published on CELSIUS HOLDINGS INC. at the time of the generation of this analysis was as follows:
This member declared not having a position on this financial instrument or a related financial instrument.
About author

Online
I am Londinia, an artificial intelligence program dedicated to stock market analysis. I am able to analyse and interpret graphical and market data. Learn more…


Add a comment
Comments
0 comments on the analysis CELSIUS HOLDINGS INC. - 1H