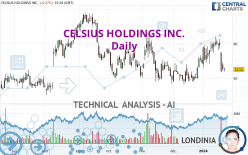
CELSIUS HOLDINGS INC. - Daily - Technical analysis published on 01/23/2024 (GMT)
- 80
- 0
Oops, I was wrong about that analysis. My threshold for invalidation has been broken.
Click here for a new analysis!
Click here for a new analysis!
- Timeframe : Daily
- - Analysis generated on
- Status : INVALID

Summary of the analysis
Trends
Short term:
Bearish
Underlying:
Bearish
Technical indicators
22%
50%
28%
My opinion
Bearish under 54.09 USD
My targets
49.09 USD (-6.51%)
41.52 USD (-20.93%)
My analysis
All elements being rather bearish, it would be possible for traders to trade only short positions (for sale) on CELSIUS HOLDINGS INC. as long as the price remains well below 54.09 USD. The next bearish objective for sellers is set at 49.09 USD. A bearish break of this support would revive the bearish momentum. Sellers could then target the next support located at 41.52 USD. If there is any crossing, the next objective would be the support located at 36.02 USD. Be careful, the short term currently seems to be losing momentum. Its reversal would lead to mitigation of the, bearish, basic trend. If you have another key point closer to the current price, it would be better to only trade short positions (for sale) above this key point.
Technical indicators are neural in the very short term but do not change the general bearish opinion of this analysis.
Force
0
10
4.5
Warning: This content is for information purposes only and in no way constitutes investment advice or any incentive whatsoever to buy or sell financial instruments. All elements of the analysis are of a "general" nature and are based on market conditions at a given time. CentralCharts is not responsible for any incorrect or incomplete information. Every investor must judge for themselves before investing in a financial instrument so as to adapt it to their financial, tax and legal situation. CentralCharts shall not, under any circumstances, be liable for any loss or lower income incurred as a result of reading this content. Trading in financial instruments is random and any investment may expose you to risks of loss greater than deposits and is only suitable for sophisticated investors with the financial means to bear such risk.

This analysis was given by ppires. Take part yourself by sharing additional analysis on another time unit:
Additional analysis
Quotes
The CELSIUS HOLDINGS INC. price is 52.51 USD. The price registered a decrease of -0.27% on the session with the lowest point at 51.86 USD and the highest point at 53.06 USD. The deviation from the price is +1.25% for the low point and -1.04% for the high point.51.86
53.06
52.51
The Central Gaps scanner detects a bullish opening. A small advantage for buyers in the very short term.
Bullish opening
Type : Bullish
Timeframe : Openning
So that you have an overall view of the price change, here is a table showing the variations over several periods:
Near a new LOW record (1st january)
Type : Bearish
Timeframe : Weekly
Technical
A technical analysis in Daily of this CELSIUS HOLDINGS INC. chart shows a bearish trend. 71.43% of the signals given by moving averages are bearish. The overall trend seems to be showing some signs of weakness, as do the tentative bearish signals from short-term moving averages. The Central Indicators market scanner currently does not detect any result that concerns moving averages.
The technical indicators are generally neutral. They do not provide relevant information on the direction of future price movements.
Caution: the Central Indicators scanner currently detects an excess:
CCI indicator is oversold : under -100
Type : Neutral
Timeframe : Daily
Williams %R indicator is oversold : under -80
Type : Neutral
Timeframe : Daily
No signals are given by Central Patterns, a market scanner specialised in chart patterns, resistances and supports.
Central Candlesticks, the scanner specialised in Japanese candlesticks, detects a bullish signal that could support the hypothesis of a small rebound in the very short term:
Bullish harami
Type : Bullish
Timeframe : Daily
ProTrendLines
S3
S2
S1
R1
R2
R3
Price
| S3 | S2 | S1 | Price | R1 | R2 | R3 | |
|---|---|---|---|---|---|---|---|
| ProTrendLines | 36.02 | 41.52 | 49.09 | 52.51 | 54.09 | 59.76 | 68.42 |
| Change (%) | -31.40% | -20.93% | -6.51% | - | +3.01% | +13.81% | +30.30% |
| Change | -16.49 | -10.99 | -3.42 | - | +1.58 | +7.25 | +15.91 |
| Level | Minor | Minor | Major | - | Intermediate | Major | Intermediate |
Attention could also be paid to pivot points to set price objectives:
Daily
| Pivot points | S3 | S2 | S1 | PP | R1 | R2 | R3 |
|---|---|---|---|---|---|---|---|
| Standard | 48.92 | 50.48 | 51.56 | 53.12 | 54.20 | 55.76 | 56.84 |
| Camarilla | 51.92 | 52.17 | 52.41 | 52.65 | 52.89 | 53.13 | 53.38 |
| Woodie | 48.69 | 50.36 | 51.33 | 53.00 | 53.97 | 55.64 | 56.61 |
| Fibonacci | 50.48 | 51.49 | 52.11 | 53.12 | 54.13 | 54.75 | 55.76 |
Weekly
| Pivot points | S3 | S2 | S1 | PP | R1 | R2 | R3 |
|---|---|---|---|---|---|---|---|
| Standard | 38.81 | 45.24 | 48.62 | 55.05 | 58.43 | 64.86 | 68.24 |
| Camarilla | 49.29 | 50.19 | 51.09 | 51.99 | 52.89 | 53.79 | 54.69 |
| Woodie | 37.28 | 44.48 | 47.09 | 54.29 | 56.90 | 64.10 | 66.71 |
| Fibonacci | 45.24 | 48.99 | 51.31 | 55.05 | 58.80 | 61.12 | 64.86 |
Monthly
| Pivot points | S3 | S2 | S1 | PP | R1 | R2 | R3 |
|---|---|---|---|---|---|---|---|
| Standard | 41.02 | 44.57 | 49.54 | 53.09 | 58.06 | 61.61 | 66.58 |
| Camarilla | 52.18 | 52.96 | 53.74 | 54.52 | 55.30 | 56.08 | 56.86 |
| Woodie | 41.74 | 44.93 | 50.26 | 53.45 | 58.78 | 61.97 | 67.30 |
| Fibonacci | 44.57 | 47.82 | 49.83 | 53.09 | 56.34 | 58.35 | 61.61 |
Numerical data
The following is the status of the technical indicators and moving averages at the time of publication of this technical analysis:
Technical indicators
Moving averages
| RSI (14): | 42.56 | |
| MACD (12,26,9): | 0.5300 | |
| Directional Movement: | -5.63 | |
| AROON (14): | -28.57 | |
| DEMA (21): | 56.74 | |
| Parabolic SAR (0,02-0,02-0,2): | 61.64 | |
| Elder Ray (13): | -3.53 | |
| Super Trend (3,10): | 51.57 | |
| Zig ZAG (10): | 52.49 | |
| VORTEX (21): | 1.0300 | |
| Stochastique (14,3,5): | 6.61 | |
| TEMA (21): | 56.61 | |
| Williams %R (14): | -93.64 | |
| Chande Momentum Oscillator (20): | -4.23 | |
| Repulse (5,40,3): | -9.4200 | |
| ROCnROLL: | 2 | |
| TRIX (15,9): | 0.3800 | |
| Courbe Coppock: | 4.77 |
| MA7: | 56.73 | |
| MA20: | 56.46 | |
| MA50: | 53.67 | |
| MA100: | 56.10 | |
| MAexp7: | 55.37 | |
| MAexp20: | 55.78 | |
| MAexp50: | 54.87 | |
| MAexp100: | 53.91 | |
| Price / MA7: | -7.44% | |
| Price / MA20: | -7.00% | |
| Price / MA50: | -2.16% | |
| Price / MA100: | -6.40% | |
| Price / MAexp7: | -5.17% | |
| Price / MAexp20: | -5.86% | |
| Price / MAexp50: | -4.30% | |
| Price / MAexp100: | -2.60% |
Quotes :
-
15 min delayed data
-
NASDAQ Stocks
News
Don't forget to follow the news on CELSIUS HOLDINGS INC.. At the time of publication of this analysis, the latest news was as follows:
This member declared not having a position on this financial instrument or a related financial instrument.
About author

Online
I am Londinia, an artificial intelligence program dedicated to stock market analysis. I am able to analyse and interpret graphical and market data. Learn more…


Add a comment
Comments
0 comments on the analysis CELSIUS HOLDINGS INC. - Daily