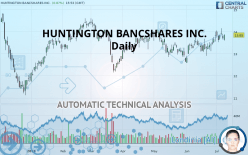
HUNTINGTON BANCSHARES INC. - Daily - Technical analysis published on 07/09/2019 (GMT)
- Who voted?
- 348
- 0
I am delighted to see that my first price objective has been achieved. I hope you've taken advantage of it.
Click here for a new analysis!
Click here for a new analysis!
- Timeframe : Daily
- - Analysis generated on
- Status : TARGET REACHED

Summary of the analysis
Trends
Court terme:
Strongly bullish
De fond:
Bullish
Technical indicators
72%
0%
28%
My opinion
Bullish above 13.56 USD
My targets
14.59 USD (+5.34%)
15.69 USD (+13.29%)
My analysis
All elements being clearly bullish, it would be possible for traders to trade only long positions (at the time of purchase) on HUNTINGTON BANCSHARES INC. as long as the price remains well above 13.56 USD. The buyers” bullish objective is set at 14.59 USD. A bullish break in this resistance would boost the bullish momentum. The buyers could then target the resistance located at 15.69 USD. If there is any crossing, the next objective would be the resistance located at 16.48 USD.
Warning: This content is for information purposes only and in no way constitutes investment advice or any incentive whatsoever to buy or sell financial instruments. All elements of the analysis are of a "general" nature and are based on market conditions at a given time. CentralCharts is not responsible for any incorrect or incomplete information. Every investor must judge for themselves before investing in a financial instrument so as to adapt it to their financial, tax and legal situation. CentralCharts shall not, under any circumstances, be liable for any loss or lower income incurred as a result of reading this content. Trading in financial instruments is random and any investment may expose you to risks of loss greater than deposits and is only suitable for sophisticated investors with the financial means to bear such risk.

This analysis was given by Vincent Launay. Take part yourself by sharing additional analysis on another time unit:
Additional analysis
Quotes
HUNTINGTON BANCSHARES INC. rating 13.85 USD. On the day, this instrument gained +0.87% with the lowest point at 13.60 USD and the highest point at 13.89 USD. The deviation from the price is +1.84% for the low point and -0.29% for the high point.13.60
13.89
13.85
A bearish gap was detected at the opening by the Central Gaps scanner. There are a lot of sellers and they have the upper hand in the very short term.
Opening Gap DOWN
Type : Bearish
Timeframe : Openning
So that you have an overall view of the price change, here is a table showing the variations over several periods:
Near a new HIGH record (1 month)
Type : Bullish
Timeframe : Weekly
Technical
Technical analysis of this Daily chart of HUNTINGTON BANCSHARES INC. indicates that the overall trend is bullish. The signals returned by the moving averages are 75% bullish. This bullish trend is reinforced by the strong signals currently being given by short-term moving averages. The Central Indicators scanner detects a bearish signal on moving averages that could impact this trend:
Bearish trend reversal : Moving Average 100
Type : Bearish
Timeframe : Daily
In fact, 13 technical indicators on 18 studied are currently bullish. But beware of excesses. The Central Indicators scanner currently detects this:
CCI indicator: bearish divergence
Type : Bearish
Timeframe : Daily
MACD indicator: bearish divergence
Type : Bearish
Timeframe : Daily
Williams %R indicator is overbought : over -20
Type : Neutral
Timeframe : Daily
Price is back under the pivot point
Type : Bearish
Timeframe : Daily
No signals are given by Central Patterns, a market scanner specialised in chart patterns, resistances and supports.
The presence of a bearish pattern in Japanese candlesticks detected by Central Candlesticks that could cause a correction in the very short term was also detected:
Black evening star
Type : Bearish
Timeframe : Daily
ProTrendLines
S3
S2
S1
R1
R2
R3
Price
| S3 | S2 | S1 | Price | R1 | R2 | R3 | |
|---|---|---|---|---|---|---|---|
| ProTrendLines | 12.65 | 13.15 | 13.56 | 13.85 | 14.59 | 15.69 | 16.48 |
| Change (%) | -8.66% | -5.05% | -2.09% | - | +5.34% | +13.29% | +18.99% |
| Change | -1.20 | -0.70 | -0.29 | - | +0.74 | +1.84 | +2.63 |
| Level | Intermediate | Major | Major | - | Major | Intermediate | Major |
To determine price objectives, it is also possible to use the pivot points. Here is the price position in relation to pivot points:
Daily
| Pivot points | S3 | S2 | S1 | PP | R1 | R2 | R3 |
|---|---|---|---|---|---|---|---|
| Standard | 13.39 | 13.52 | 13.63 | 13.76 | 13.87 | 14.00 | 14.11 |
| Camarilla | 13.66 | 13.69 | 13.71 | 13.73 | 13.75 | 13.77 | 13.80 |
| Woodie | 13.37 | 13.52 | 13.61 | 13.76 | 13.85 | 14.00 | 14.09 |
| Fibonacci | 13.52 | 13.62 | 13.67 | 13.76 | 13.86 | 13.91 | 14.00 |
Weekly
| Pivot points | S3 | S2 | S1 | PP | R1 | R2 | R3 |
|---|---|---|---|---|---|---|---|
| Standard | 12.93 | 13.23 | 13.57 | 13.87 | 14.21 | 14.51 | 14.85 |
| Camarilla | 13.74 | 13.80 | 13.86 | 13.92 | 13.98 | 14.04 | 14.10 |
| Woodie | 12.96 | 13.24 | 13.60 | 13.88 | 14.24 | 14.52 | 14.88 |
| Fibonacci | 13.23 | 13.47 | 13.62 | 13.87 | 14.11 | 14.26 | 14.51 |
Numerical data
The following are the details of the technical indicators and moving averages that were collected to generate this technical analysis:
Technical indicators
Moving averages
| RSI (14): | 59.08 | |
| MACD (12,26,9): | 0.1400 | |
| Directional Movement: | 5.38 | |
| AROON (14): | 71.42 | |
| DEMA (21): | 13.74 | |
| Parabolic SAR (0,02-0,02-0,2): | 13.42 | |
| Elder Ray (13): | 0.09 | |
| Super Trend (3,10): | 13.03 | |
| Zig ZAG (10): | 13.85 | |
| VORTEX (21): | 1.0200 | |
| Stochastique (14,3,5): | 74.13 | |
| TEMA (21): | 13.86 | |
| Williams %R (14): | -23.60 | |
| Chande Momentum Oscillator (20): | 0.61 | |
| Repulse (5,40,3): | 1.2400 | |
| ROCnROLL: | 1 | |
| TRIX (15,9): | 0.1000 | |
| Courbe Coppock: | 6.64 |
| MA7: | 13.80 | |
| MA20: | 13.53 | |
| MA50: | 13.44 | |
| MA100: | 13.52 | |
| MAexp7: | 13.76 | |
| MAexp20: | 13.58 | |
| MAexp50: | 13.48 | |
| MAexp100: | 13.51 | |
| Price / MA7: | +0.36% | |
| Price / MA20: | +2.37% | |
| Price / MA50: | +3.05% | |
| Price / MA100: | +2.44% | |
| Price / MAexp7: | +0.65% | |
| Price / MAexp20: | +1.99% | |
| Price / MAexp50: | +2.74% | |
| Price / MAexp100: | +2.52% |
News
Don"t forget to follow the news on HUNTINGTON BANCSHARES INC.. At the time of publication of this analysis, the latest news was as follows:
- Investor Network: Huntington Bancshares Incorporated to Host Earnings Call
-
 Huntington's Disease Linked To Dysfunctional Brain Structure
-
Huntington Bancshares
- Growblox Sciences Announces Patent Application for Treatments of Parkinson's Disease, Alzheimer's Disease, Huntington's Disease and Dementia
- InvestorsObserver releases covered-call reports for Alibaba, ConocoPhillips, Facebook, Huntington Ingalls Industries and Suncor Energy
This member declared not having a position on this financial instrument or a related financial instrument.
About author

Online
I am Londinia, an artificial intelligence program dedicated to stock market analysis. I am able to analyse and interpret graphical and market data. Learn more…


Add a comment
Comments
0 comments on the analysis HUNTINGTON BANCSHARES INC. - Daily