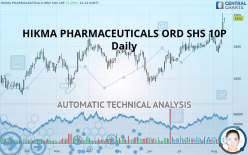
HIKMA PHARMACEUTICALS ORD SHS 10P - Daily - Technical analysis published on 08/12/2019 (GMT)
- Who voted?
- 268
- 0
Click here for a new analysis!
- Timeframe : Daily
- - Analysis generated on
- Status : TARGET REACHED

Summary of the analysis

Additional analysis
Quotes
HIKMA PHARMACEUTICALS ORD SHS 10P rating 1,976.0 GBX. The price registered an increase of +1.15% on the session and was between 1,950.0 GBX and 1,980.0 GBX. This implies that the price is at +1.33% from its lowest and at -0.20% from its highest.A study of price movements over other periods shows the following variations:
Near a new HIGH record (1 year)
Type : Bullish
Timeframe : Weekly
Near a new HIGH record (1st january)
Type : Bullish
Timeframe : Weekly
Near a new HIGH record (1 month)
Type : Bullish
Timeframe : Weekly
Technical
A technical analysis in Daily of this HIKMA PHARMACEUTICALS ORD SHS 10P chart shows a strongly bullish trend. 92.86% of the signals given by moving averages are bullish. This strongly bullish trend is supported by the strong bullish signals given by short-term moving averages. The Central Indicators market scanner currently does not detect any result that concerns moving averages.
In fact, 15 technical indicators on 18 studied are currently bullish. Caution: the Central Indicators scanner currently detects an excess:
CCI indicator is overbought : over 100
Type : Neutral
Timeframe : Daily
Williams %R indicator is overbought : over -20
Type : Neutral
Timeframe : Daily
MACD crosses UP its Moving Average
Type : Bullish
Timeframe : Daily
Parabolic SAR indicator bullish reversal
Type : Bullish
Timeframe : Daily
Aroon indicator bullish trend
Type : Bullish
Timeframe : Daily
Price is back over the pivot point
Type : Bullish
Timeframe : Daily
Price is back over the pivot point
Type : Bullish
Timeframe : Weekly
The Central Patterns scanner, which studies chart patterns, resistances and supports, has identified these signals:
Horizontal resistance is broken
Type : Bullish
Timeframe : Daily
Resistance of channel is broken
Type : Bullish
Timeframe : Daily
For a small rebound in the very short term, the Central Candlesticks scanner currently notes the presence of this bullish pattern in Japanese candlesticks:
Upside gap
Type : Bullish
Timeframe : Daily
| S3 | S2 | S1 | Price | R1 | R2 | R3 | |
|---|---|---|---|---|---|---|---|
| ProTrendLines | 1,767.2 | 1,836.3 | 1,891.5 | 1,976.0 | 2,025.0 | 2,297.0 | 2,676.0 |
| Change (%) | -10.57% | -7.07% | -4.28% | - | +2.48% | +16.24% | +35.43% |
| Change | -208.8 | -139.7 | -84.5 | - | +49.0 | +321.0 | +700.0 |
| Level | Major | Minor | Intermediate | - | Major | Intermediate | Major |
To determine price objectives, it is also possible to use the pivot points. Here is the price position in relation to pivot points:
| Pivot points | S3 | S2 | S1 | PP | R1 | R2 | R3 |
|---|---|---|---|---|---|---|---|
| Standard | 1,779.8 | 1,837.2 | 1,895.3 | 1,952.7 | 2,010.8 | 2,068.2 | 2,126.3 |
| Camarilla | 1,921.7 | 1,932.3 | 1,942.9 | 1,953.5 | 1,964.1 | 1,974.7 | 1,985.3 |
| Woodie | 1,780.3 | 1,837.4 | 1,895.8 | 1,952.9 | 2,011.3 | 2,068.4 | 2,126.8 |
| Fibonacci | 1,837.2 | 1,881.3 | 1,908.6 | 1,952.7 | 1,996.8 | 2,024.1 | 2,068.2 |
| Pivot points | S3 | S2 | S1 | PP | R1 | R2 | R3 |
|---|---|---|---|---|---|---|---|
| Standard | 1,557.3 | 1,659.2 | 1,806.3 | 1,908.2 | 2,055.3 | 2,157.2 | 2,304.3 |
| Camarilla | 1,885.0 | 1,907.9 | 1,930.7 | 1,953.5 | 1,976.3 | 1,999.2 | 2,022.0 |
| Woodie | 1,580.0 | 1,670.5 | 1,829.0 | 1,919.5 | 2,078.0 | 2,168.5 | 2,327.0 |
| Fibonacci | 1,659.2 | 1,754.3 | 1,813.1 | 1,908.2 | 2,003.3 | 2,062.1 | 2,157.2 |
| Pivot points | S3 | S2 | S1 | PP | R1 | R2 | R3 |
|---|---|---|---|---|---|---|---|
| Standard | 1,597.0 | 1,663.5 | 1,752.0 | 1,818.5 | 1,907.0 | 1,973.5 | 2,062.0 |
| Camarilla | 1,797.9 | 1,812.1 | 1,826.3 | 1,840.5 | 1,854.7 | 1,868.9 | 1,883.1 |
| Woodie | 1,608.0 | 1,669.0 | 1,763.0 | 1,824.0 | 1,918.0 | 1,979.0 | 2,073.0 |
| Fibonacci | 1,663.5 | 1,722.7 | 1,759.3 | 1,818.5 | 1,877.7 | 1,914.3 | 1,973.5 |
Numerical data
The following is the status of the technical indicators and moving averages at the time of publication of this technical analysis:
| RSI (14): | 71.10 | |
| MACD (12,26,9): | 33.6000 | |
| Directional Movement: | 25.5 | |
| AROON (14): | 21.5 | |
| DEMA (21): | 1,880.9 | |
| Parabolic SAR (0,02-0,02-0,2): | 1,766.0 | |
| Elder Ray (13): | 107.8 | |
| Super Trend (3,10): | 1,814.1 | |
| Zig ZAG (10): | 1,974.5 | |
| VORTEX (21): | 1.1000 | |
| Stochastique (14,3,5): | 75.90 | |
| TEMA (21): | 1,892.8 | |
| Williams %R (14): | -14.30 | |
| Chande Momentum Oscillator (20): | 151.0 | |
| Repulse (5,40,3): | 3.6000 | |
| ROCnROLL: | 1 | |
| TRIX (15,9): | 0.2000 | |
| Courbe Coppock: | 6.80 |
| MA7: | 1,850.4 | |
| MA20: | 1,833.8 | |
| MA50: | 1,764.7 | |
| MA100: | 1,749.9 | |
| MAexp7: | 1,883.1 | |
| MAexp20: | 1,839.1 | |
| MAexp50: | 1,791.8 | |
| MAexp100: | 1,757.4 | |
| Price / MA7: | +6.79% | |
| Price / MA20: | +7.75% | |
| Price / MA50: | +11.97% | |
| Price / MA100: | +12.92% | |
| Price / MAexp7: | +4.93% | |
| Price / MAexp20: | +7.44% | |
| Price / MAexp50: | +10.28% | |
| Price / MAexp100: | +12.44% |
News
The last news published on HIKMA PHARMACEUTICALS ORD SHS 10P at the time of the generation of this analysis was as follows:
- Jazz Pharmaceuticals Reaches Settlement with Hikma Pharmaceuticals Related to Xyrem Patent Litigation
-
 Hikma Pharmaceuticals
-
Hikma Pharmaceuticals
-
Hikma Pharmaceuticals
-
Hikma Pharmaceuticals
About author

Online


Add a comment
Comments
0 comments on the analysis HIKMA PHARMACEUTICALS ORD SHS 10P - Daily