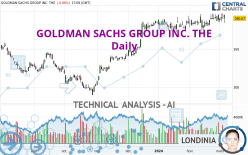
GOLDMAN SACHS GROUP INC. THE - Daily - Technical analysis published on 03/06/2024 (GMT)
- 102
- 0
Click here for a new analysis!
- Timeframe : Daily
- - Analysis generated on
- Status : TARGET REACHED

Summary of the analysis

Additional analysis
Quotes
GOLDMAN SACHS GROUP INC. THE rating 390.67 USD. The price registered a decrease of -0.06% on the session with the lowest point at 384.52 USD and the highest point at 395.29 USD. The deviation from the price is +1.60% for the low point and -1.17% for the high point.The Central Gaps scanner detects a bullish opening marking the presence of buyers ahead of sellers at the opening but not sufficiently marked to allow the price to register a quotation gap.
Bullish opening
Type : Bullish
Timeframe : Openning
Here is a more detailed summary of the historical variations registered by GOLDMAN SACHS GROUP INC. THE:
Near a new HIGH record (5 years)
Type : Bullish
Timeframe : Weekly
Near a new HIGH record (1 year)
Type : Bullish
Timeframe : Weekly
Near a new LOW record (1st january)
Type : Bearish
Timeframe : Weekly
Near a new LOW record (1 month)
Type : Bearish
Timeframe : Weekly
Technical
Technical analysis of this Daily chart of GOLDMAN SACHS GROUP INC. THE indicates that the overall trend is strongly bullish. 92.86% of the signals given by moving averages are bullish. The overall trend is supported by the strong bullish signals from short-term moving averages. The Central Indicators scanner does not detect any result on moving averages that would impact this trend.
The technical indicators are bullish. There is still some doubt about the price increase.
Caution: the Central Indicators scanner currently detects an excess:
MACD indicator: bearish divergence
Type : Bearish
Timeframe : Daily
Williams %R indicator is overbought : over -20
Type : Neutral
Timeframe : Daily
Price is back over the pivot point
Type : Bullish
Timeframe : Weekly
Price is back under the pivot point
Type : Bearish
Timeframe : Daily
Central Patterns, the market scanner focusing on chart patterns, resistances and supports found this result:
Near horizontal resistance
Type : Bearish
Timeframe : Daily
Central Candlesticks, the scanner specialised in Japanese candlesticks, detects a bearish signal that could support the hypothesis of a small drop in the very short term:
Bearish engulfing lines
Type : Bearish
Timeframe : Daily
| S3 | S2 | S1 | Price | R1 | |
|---|---|---|---|---|---|
| ProTrendLines | 325.18 | 350.95 | 375.01 | 390.67 | 398.37 |
| Change (%) | -16.76% | -10.17% | -4.01% | - | +1.97% |
| Change | -65.49 | -39.72 | -15.66 | - | +7.70 |
| Level | Minor | Major | Intermediate | - | Major |
Attention could also be paid to pivot points to set price objectives:
| Pivot points | S3 | S2 | S1 | PP | R1 | R2 | R3 |
|---|---|---|---|---|---|---|---|
| Standard | 381.14 | 385.72 | 388.32 | 392.90 | 395.50 | 400.08 | 402.68 |
| Camarilla | 388.94 | 389.59 | 390.25 | 390.91 | 391.57 | 392.23 | 392.89 |
| Woodie | 380.14 | 385.23 | 387.32 | 392.41 | 394.50 | 399.59 | 401.68 |
| Fibonacci | 385.72 | 388.47 | 390.16 | 392.90 | 395.65 | 397.34 | 400.08 |
| Pivot points | S3 | S2 | S1 | PP | R1 | R2 | R3 |
|---|---|---|---|---|---|---|---|
| Standard | 372.84 | 379.05 | 383.57 | 389.78 | 394.30 | 400.51 | 405.03 |
| Camarilla | 385.15 | 386.13 | 387.12 | 388.10 | 389.08 | 390.07 | 391.05 |
| Woodie | 372.01 | 378.63 | 382.74 | 389.36 | 393.47 | 400.09 | 404.20 |
| Fibonacci | 379.05 | 383.15 | 385.68 | 389.78 | 393.88 | 396.41 | 400.51 |
| Pivot points | S3 | S2 | S1 | PP | R1 | R2 | R3 |
|---|---|---|---|---|---|---|---|
| Standard | 352.33 | 362.44 | 375.75 | 385.86 | 399.17 | 409.28 | 422.59 |
| Camarilla | 382.61 | 384.76 | 386.90 | 389.05 | 391.20 | 393.34 | 395.49 |
| Woodie | 353.92 | 363.24 | 377.34 | 386.66 | 400.76 | 410.08 | 424.18 |
| Fibonacci | 362.44 | 371.39 | 376.92 | 385.86 | 394.81 | 400.34 | 409.28 |
Numerical data
The following is the status of technical indicators and moving averages registered at the time this technical analysis was created:
| RSI (14): | 58.14 | |
| MACD (12,26,9): | 3.4800 | |
| Directional Movement: | 9.83 | |
| AROON (14): | 92.86 | |
| DEMA (21): | 390.95 | |
| Parabolic SAR (0,02-0,02-0,2): | 381.65 | |
| Elder Ray (13): | 1.43 | |
| Super Trend (3,10): | 370.90 | |
| Zig ZAG (10): | 390.60 | |
| VORTEX (21): | 1.0100 | |
| Stochastique (14,3,5): | 74.03 | |
| TEMA (21): | 390.64 | |
| Williams %R (14): | -32.71 | |
| Chande Momentum Oscillator (20): | 8.88 | |
| Repulse (5,40,3): | -1.0200 | |
| ROCnROLL: | 1 | |
| TRIX (15,9): | 0.1100 | |
| Courbe Coppock: | 4.71 |
| MA7: | 390.36 | |
| MA20: | 385.84 | |
| MA50: | 382.42 | |
| MA100: | 355.30 | |
| MAexp7: | 389.95 | |
| MAexp20: | 386.64 | |
| MAexp50: | 378.17 | |
| MAexp100: | 363.86 | |
| Price / MA7: | +0.08% | |
| Price / MA20: | +1.25% | |
| Price / MA50: | +2.16% | |
| Price / MA100: | +9.95% | |
| Price / MAexp7: | +0.18% | |
| Price / MAexp20: | +1.04% | |
| Price / MAexp50: | +3.31% | |
| Price / MAexp100: | +7.37% |
News
Don't forget to follow the news on GOLDMAN SACHS GROUP INC. THE. At the time of publication of this analysis, the latest news was as follows:
- Goldman Sachs BDC, Inc. Schedules Earnings Release and Conference Call to Announce Third Quarter 2019 Results
- Patient Access Solutions, Inc. COO, Dr. Donald Chiappetta Exclusive Interview on StockTradersTalk.com
- Patient Access Solutions, Inc. Announces Director of Behavioral Health
- Patient Access Solutions Inc. to Acquire Healthcare Practice
- Patient Access Solutions, Inc. Updates Shareholders
About author
Online


Add a comment
Comments
0 comments on the analysis GOLDMAN SACHS GROUP INC. THE - Daily