IMMUNITYBIO INC. - Daily - Technical analysis published on 02/25/2024 (GMT)
- 98
- 0
- Timeframe : Daily
- - Analysis generated on
- Status : NEUTRAL
Summary of the analysis

Additional analysis
Quotes
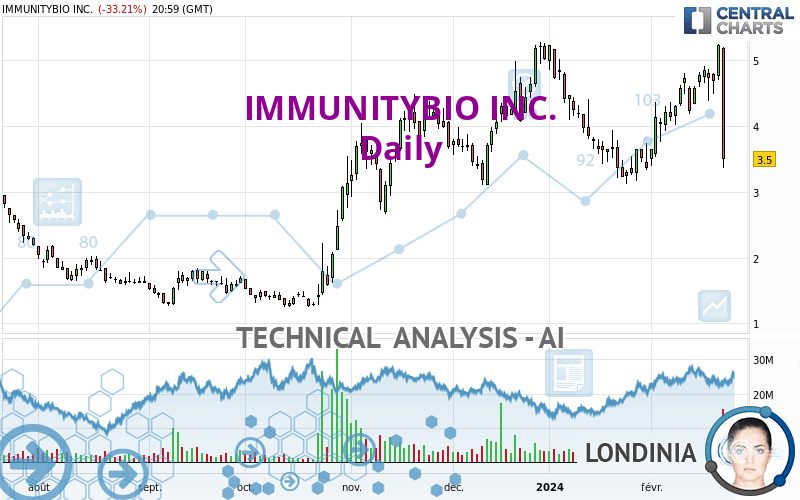
IMMUNITYBIO INC. rating 3.50 USD. The price registered a decrease of -33.21% on the session with the lowest point at 3.37 USD and the highest point at 5.21 USD. The deviation from the price is +3.86% for the low point and -32.82% for the high point.A bearish opening was detected by the Central Gaps scanner. Sellers are trying to impose a bearish trend in the very short term.
Bearish opening
Type : Bearish
Timeframe : Openning
So that you have an overall view of the price change, here is a table showing the variations over several periods:
Near a new HIGH record (1st january)
Type : Bullish
Timeframe : Weekly
Near a new HIGH record (1 month)
Type : Bullish
Timeframe : Weekly
Technical
Technical analysis of this Daily chart of IMMUNITYBIO INC. indicates that the overall trend is not clearly defined. This indecision could turn into a bearish trend due to the slightly bearish signals currently given by short-term moving averages. An assessment of moving averages reveals several bearish signals that could impact this trend:
Bearish price crossover with Moving Average 20
Type : Bearish
Timeframe : Daily
Bearish price crossover with Moving Average 50
Type : Bearish
Timeframe : Daily
Bearish price crossover with adaptative moving average 20
Type : Bearish
Timeframe : Daily
Bearish price crossover with adaptative moving average 50
Type : Bearish
Timeframe : Daily
Bearish price crossover with adaptative moving average 100
Type : Bearish
Timeframe : Daily
An assessment of technical indicators shows a slightly bearish signal.
Caution: the Central Indicators scanner currently detects an excess:
CCI indicator: bearish divergence
Type : Bearish
Timeframe : Daily
RSI indicator: bearish divergence
Type : Bearish
Timeframe : Daily
Williams %R indicator is oversold : under -80
Type : Neutral
Timeframe : Daily
Pivot points : price is under support 3
Type : Neutral
Timeframe : Daily
Pivot points : price is under support 3
Type : Neutral
Timeframe : Weekly
RSI indicator is back under 50
Type : Bearish
Timeframe : Daily
MACD crosses DOWN its Moving Average
Type : Bearish
Timeframe : Daily
Parabolic SAR indicator bearish reversal
Type : Bearish
Timeframe : Daily
Ichimoku : price is under the cloud
Type : Bearish
Timeframe : Daily
SuperTrend indicator bearish reversal
Type : Bearish
Timeframe : Daily
Momentum indicator is back under 0
Type : Bearish
Timeframe : Daily
Central Patterns, the scanner specializing in chart patterns, did not identify any signals.
Central Candlesticks, the scanner specialised in Japanese candlesticks, detects a bearish signal that could support the hypothesis of a small drop in the very short term:
Long black line
Type : Bearish
Timeframe : Daily
| S3 | S2 | S1 | Price | R1 | R2 | R3 | |
|---|---|---|---|---|---|---|---|
| ProTrendLines | 1.27 | 2.75 | 3.23 | 3.50 | 4.22 | 6.70 | 15.36 |
| Change (%) | -63.71% | -21.43% | -7.71% | - | +20.57% | +91.43% | +338.86% |
| Change | -2.23 | -0.75 | -0.27 | - | +0.72 | +3.20 | +11.86 |
| Level | Minor | Major | Major | - | Intermediate | Intermediate | Intermediate |
Attention could also be paid to pivot points to set price objectives:
| Pivot points | S3 | S2 | S1 | PP | R1 | R2 | R3 |
|---|---|---|---|---|---|---|---|
| Standard | 1.00 | 2.19 | 2.84 | 4.03 | 4.68 | 5.87 | 6.52 |
| Camarilla | 2.99 | 3.16 | 3.33 | 3.50 | 3.67 | 3.84 | 4.01 |
| Woodie | 0.74 | 2.06 | 2.58 | 3.90 | 4.42 | 5.74 | 6.26 |
| Fibonacci | 2.19 | 2.89 | 3.32 | 4.03 | 4.73 | 5.16 | 5.87 |
| Pivot points | S3 | S2 | S1 | PP | R1 | R2 | R3 |
|---|---|---|---|---|---|---|---|
| Standard | 0.95 | 2.16 | 2.83 | 4.04 | 4.71 | 5.92 | 6.59 |
| Camarilla | 2.98 | 3.16 | 3.33 | 3.50 | 3.67 | 3.85 | 4.02 |
| Woodie | 0.68 | 2.03 | 2.56 | 3.91 | 4.44 | 5.79 | 6.32 |
| Fibonacci | 2.16 | 2.88 | 3.32 | 4.04 | 4.76 | 5.20 | 5.92 |
| Pivot points | S3 | S2 | S1 | PP | R1 | R2 | R3 |
|---|---|---|---|---|---|---|---|
| Standard | 0.45 | 1.79 | 2.57 | 3.91 | 4.69 | 6.03 | 6.81 |
| Camarilla | 2.78 | 2.97 | 3.17 | 3.36 | 3.55 | 3.75 | 3.94 |
| Woodie | 0.18 | 1.65 | 2.30 | 3.77 | 4.42 | 5.89 | 6.54 |
| Fibonacci | 1.79 | 2.60 | 3.10 | 3.91 | 4.72 | 5.22 | 6.03 |
Numerical data
The following is the status of technical indicators and moving averages registered at the time this technical analysis was created:
| RSI (14): | 41.07 | |
| MACD (12,26,9): | 0.1600 | |
| Directional Movement: | -7.57 | |
| AROON (14): | -7.14 | |
| DEMA (21): | 4.52 | |
| Parabolic SAR (0,02-0,02-0,2): | 5.25 | |
| Elder Ray (13): | -0.12 | |
| Super Trend (3,10): | 5.89 | |
| Zig ZAG (10): | 3.50 | |
| VORTEX (21): | 0.9800 | |
| Stochastique (14,3,5): | 63.58 | |
| TEMA (21): | 4.62 | |
| Williams %R (14): | -93.09 | |
| Chande Momentum Oscillator (20): | -0.72 | |
| Repulse (5,40,3): | -51.8900 | |
| ROCnROLL: | 2 | |
| TRIX (15,9): | 0.5500 | |
| Courbe Coppock: | 46.65 |
| MA7: | 4.62 | |
| MA20: | 4.21 | |
| MA50: | 4.20 | |
| MA100: | 3.50 | |
| MAexp7: | 4.46 | |
| MAexp20: | 4.32 | |
| MAexp50: | 4.06 | |
| MAexp100: | 3.64 | |
| Price / MA7: | -24.24% | |
| Price / MA20: | -16.86% | |
| Price / MA50: | -16.67% | |
| Price / MA100: | -0% | |
| Price / MAexp7: | -21.52% | |
| Price / MAexp20: | -18.98% | |
| Price / MAexp50: | -13.79% | |
| Price / MAexp100: | -3.85% |
News
The last news published on IMMUNITYBIO INC. at the time of the generation of this analysis was as follows:
About author

Online


Add a comment
Comments
0 comments on the analysis IMMUNITYBIO INC. - Daily