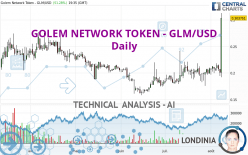
GOLEM NETWORK TOKEN - GLM/USD - Daily - Technical analysis published on 08/08/2023 (GMT)
- 149
- 0
Click here for a new analysis!
- Timeframe : Daily
- - Analysis generated on
- Status : INVALID

Summary of the analysis

Additional analysis
Quotes
GOLEM NETWORK TOKEN - GLM/USD rating 0.303751 USD. On the day, this instrument gained +51.28% with the lowest point at 0.191966 USD and the highest point at 0.312845 USD. The deviation from the price is +58.23% for the low point and -2.91% for the high point.A bearish opening was detected by the Central Gaps scanner. Sellers are trying to impose a bearish trend in the very short term.
Bearish opening
Type : Bearish
Timeframe : Openning
Here is a more detailed summary of the historical variations registered by GOLEM NETWORK TOKEN - GLM/USD:
New HIGH record (1 month)
Type : Bullish
Timeframe : Weekly
Technical
Technical analysis of this Daily chart of GOLEM NETWORK TOKEN - GLM/USD indicates that the overall trend is strongly bullish. 85.71% of the signals given by moving averages are bullish. The overall trend is supported by the strong bullish signals from short-term moving averages. The Central Indicators scanner detects bullish signals on moving averages that could impact this trend:
Moving Average bullish crossovers : AMA20 & AMA50
Type : Bullish
Timeframe : Daily
Bullish price crossover with Moving Average 20
Type : Bullish
Timeframe : Daily
Bullish price crossover with adaptative moving average 100
Type : Bullish
Timeframe : Daily
In fact, 15 technical indicators on 18 studied are currently positioned bullish. Caution: the Central Indicators scanner currently detects an excess:
RSI indicator is overbought : over 70
Type : Neutral
Timeframe : Daily
CCI indicator is overbought : over 100
Type : Neutral
Timeframe : Daily
Williams %R indicator is overbought : over -20
Type : Neutral
Timeframe : Daily
Pivot points : price is over resistance 3
Type : Neutral
Timeframe : Daily
Pivot points : price is over resistance 3
Type : Neutral
Timeframe : Weekly
MACD crosses UP its Moving Average
Type : Bullish
Timeframe : Daily
Ichimoku : price is over the cloud
Type : Bullish
Timeframe : Daily
Central Patterns, the market scanner focusing on chart patterns, resistances and supports found this result:
Near support of triangle
Type : Bullish
Timeframe : Daily
Central Candlesticks, the scanner specialised in Japanese candlesticks, detects these bullish signals that could support the hypothesis of a small rebound in the very short term:
Bullish engulfing lines
Type : Bullish
Timeframe : Daily
Long white line
Type : Bullish
Timeframe : Daily
| S3 | S2 | S1 | Price | R1 | R2 | R3 | |
|---|---|---|---|---|---|---|---|
| ProTrendLines | 0.220362 | 0.234744 | 0.267822 | 0.303751 | 0.405378 | 0.680000 | 0.796379 |
| Change (%) | -27.45% | -22.72% | -11.83% | - | +33.46% | +123.87% | +162.18% |
| Change | -0.083389 | -0.069007 | -0.035929 | - | +0.101627 | +0.376249 | +0.492628 |
| Level | Major | Minor | Major | - | Minor | Minor | Major |
To determine price objectives, it is also possible to use the pivot points. Here is the price position in relation to pivot points:
| Pivot points | S3 | S2 | S1 | PP | R1 | R2 | R3 |
|---|---|---|---|---|---|---|---|
| Standard | 0.181286 | 0.187824 | 0.194303 | 0.200841 | 0.207320 | 0.213858 | 0.220337 |
| Camarilla | 0.197202 | 0.198396 | 0.199589 | 0.200782 | 0.201975 | 0.203169 | 0.204362 |
| Woodie | 0.181257 | 0.187809 | 0.194274 | 0.200826 | 0.207291 | 0.213843 | 0.220308 |
| Fibonacci | 0.187824 | 0.192797 | 0.195869 | 0.200841 | 0.205814 | 0.208886 | 0.213858 |
| Pivot points | S3 | S2 | S1 | PP | R1 | R2 | R3 |
|---|---|---|---|---|---|---|---|
| Standard | 0.179304 | 0.188061 | 0.201082 | 0.209839 | 0.222860 | 0.231617 | 0.244638 |
| Camarilla | 0.208114 | 0.210110 | 0.212107 | 0.214103 | 0.216099 | 0.218096 | 0.220092 |
| Woodie | 0.181436 | 0.189127 | 0.203214 | 0.210905 | 0.224992 | 0.232683 | 0.246770 |
| Fibonacci | 0.188061 | 0.196380 | 0.201520 | 0.209839 | 0.218158 | 0.223298 | 0.231617 |
| Pivot points | S3 | S2 | S1 | PP | R1 | R2 | R3 |
|---|---|---|---|---|---|---|---|
| Standard | 0.109443 | 0.142525 | 0.175469 | 0.208551 | 0.241495 | 0.274577 | 0.307521 |
| Camarilla | 0.190257 | 0.196309 | 0.202362 | 0.208414 | 0.214466 | 0.220519 | 0.226571 |
| Woodie | 0.109375 | 0.142491 | 0.175401 | 0.208517 | 0.241427 | 0.274543 | 0.307453 |
| Fibonacci | 0.142525 | 0.167747 | 0.183329 | 0.208551 | 0.233773 | 0.249355 | 0.274577 |
Numerical data
The following is the status of the technical indicators and moving averages at the time of publication of this technical analysis:
| RSI (14): | 79.08 | |
| MACD (12,26,9): | 0.0085 | |
| Directional Movement: | 29.323929 | |
| AROON (14): | 78.571429 | |
| DEMA (21): | 0.220100 | |
| Parabolic SAR (0,02-0,02-0,2): | 0.178134 | |
| Elder Ray (13): | 0.022953 | |
| Super Trend (3,10): | 0.174931 | |
| Zig ZAG (10): | 0.280481 | |
| VORTEX (21): | 0.9854 | |
| Stochastique (14,3,5): | 77.47 | |
| TEMA (21): | 0.230611 | |
| Williams %R (14): | -4.14 | |
| Chande Momentum Oscillator (20): | 0.086470 | |
| Repulse (5,40,3): | 36.4127 | |
| ROCnROLL: | 1 | |
| TRIX (15,9): | 0.3409 | |
| Courbe Coppock: | 19.65 |
| MA7: | 0.218646 | |
| MA20: | 0.207000 | |
| MA50: | 0.196694 | |
| MA100: | 0.200008 | |
| MAexp7: | 0.225244 | |
| MAexp20: | 0.210659 | |
| MAexp50: | 0.203000 | |
| MAexp100: | 0.204643 | |
| Price / MA7: | +38.92% | |
| Price / MA20: | +46.74% | |
| Price / MA50: | +54.43% | |
| Price / MA100: | +51.87% | |
| Price / MAexp7: | +34.85% | |
| Price / MAexp20: | +44.19% | |
| Price / MAexp50: | +49.63% | |
| Price / MAexp100: | +48.43% |
About author
Online


Add a comment
Comments
0 comments on the analysis GOLEM NETWORK TOKEN - GLM/USD - Daily