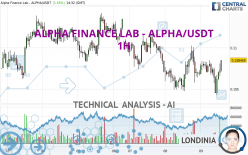
ALPHA FINANCE LAB - ALPHA/USDT - 1H - Technical analysis published on 05/09/2024 (GMT)
- 68
- 0
- Timeframe : 1H
- - Analysis generated on
- Status : NEUTRAL

Summary of the analysis

Additional analysis
Quotes
The ALPHA FINANCE LAB - ALPHA/USDT rating is 0.108452 USDT. The price has increased by +1.53% since the last closing with the lowest point at 0.104250 USDT and the highest point at 0.108493 USDT. The deviation from the price is +4.03% for the low point and -0.04% for the high point.A bearish opening was detected by the Central Gaps scanner. Sellers are trying to impose a bearish trend in the very short term.
Bearish opening
Type : Bearish
Timeframe : Openning
So that you have an overall view of the price change, here is a table showing the variations over several periods:
Technical
A technical analysis in 1H of this ALPHA FINANCE LAB - ALPHA/USDT chart shows a slightly bearish trend. Only 60.71% of the signals given by moving averages are bearish. This slightly bearish trend could turn neutral or reverse given the slightly bullish signals currently being given by short-term moving averages. The Central Indicators scanner detects bullish signals on moving averages that could impact this trend:
Bullish trend reversal : adaptative moving average 20
Type : Bullish
Timeframe : 1 hour
Bullish price crossover with Moving Average 20
Type : Bullish
Timeframe : 1 hour
Bullish price crossover with Moving Average 50
Type : Bullish
Timeframe : 1 hour
Bullish price crossover with adaptative moving average 50
Type : Bullish
Timeframe : 1 hour
The technical indicators are bullish. There is still some doubt about the price increase.
But beware of excesses. The Central Indicators scanner currently detects this:
Williams %R indicator is overbought : over -20
Type : Neutral
Timeframe : 1 hour
MACD crosses UP its Moving Average
Type : Bullish
Timeframe : 1 hour
Parabolic SAR indicator bullish reversal
Type : Bullish
Timeframe : 1 hour
Price is back over the pivot point
Type : Bullish
Timeframe : 1 hour
Price is back under the pivot point
Type : Bearish
Timeframe : Weekly
Momentum indicator is back over 0
Type : Bullish
Timeframe : 1 hour
An analysis of the price chart with the Central Patterns scanner (detector of chart patterns and resistances and supports) shows a result that can have an impact on the price change:
Near resistance of triangle
Type : Bearish
Timeframe : 1 hour
No result was found by the Central Candlesticks scanner on Japanese candlesticks.
| S3 | S2 | S1 | Price | R1 | R2 | R3 | |
|---|---|---|---|---|---|---|---|
| ProTrendLines | 0.104751 | 0.106764 | 0.108230 | 0.108452 | 0.110292 | 0.112353 | 0.132312 |
| Change (%) | -3.41% | -1.56% | -0.20% | - | +1.70% | +3.60% | +22.00% |
| Change | -0.003701 | -0.001688 | -0.000222 | - | +0.001840 | +0.003901 | +0.023860 |
| Level | Intermediate | Minor | Intermediate | - | Minor | Major | Minor |
Pivot points can also be used to set your price objectives. Here is the price situation in relation to pivot points:
| Pivot points | S3 | S2 | S1 | PP | R1 | R2 | R3 |
|---|---|---|---|---|---|---|---|
| Standard | 0.098742 | 0.101737 | 0.104276 | 0.107271 | 0.109810 | 0.112805 | 0.115344 |
| Camarilla | 0.105294 | 0.105801 | 0.106309 | 0.106816 | 0.107323 | 0.107831 | 0.108338 |
| Woodie | 0.098515 | 0.101623 | 0.104049 | 0.107157 | 0.109583 | 0.112691 | 0.115117 |
| Fibonacci | 0.101737 | 0.103851 | 0.105157 | 0.107271 | 0.109385 | 0.110691 | 0.112805 |
| Pivot points | S3 | S2 | S1 | PP | R1 | R2 | R3 |
|---|---|---|---|---|---|---|---|
| Standard | 0.076804 | 0.086878 | 0.098840 | 0.108914 | 0.120876 | 0.130950 | 0.142912 |
| Camarilla | 0.104743 | 0.106763 | 0.108783 | 0.110803 | 0.112823 | 0.114843 | 0.116863 |
| Woodie | 0.077749 | 0.087350 | 0.099785 | 0.109386 | 0.121821 | 0.131422 | 0.143857 |
| Fibonacci | 0.086878 | 0.095295 | 0.100496 | 0.108914 | 0.117331 | 0.122532 | 0.130950 |
| Pivot points | S3 | S2 | S1 | PP | R1 | R2 | R3 |
|---|---|---|---|---|---|---|---|
| Standard | -0.038514 | 0.030234 | 0.067857 | 0.136605 | 0.174228 | 0.242976 | 0.280599 |
| Camarilla | 0.076227 | 0.085978 | 0.095728 | 0.105479 | 0.115230 | 0.124980 | 0.134731 |
| Woodie | -0.054078 | 0.022453 | 0.052294 | 0.128824 | 0.158665 | 0.235195 | 0.265036 |
| Fibonacci | 0.030234 | 0.070868 | 0.095972 | 0.136605 | 0.177239 | 0.202343 | 0.242976 |
Numerical data
The following is the status of technical indicators and moving averages registered at the time this technical analysis was created:
| RSI (14): | 53.00 | |
| MACD (12,26,9): | -0.0002 | |
| Directional Movement: | -4.162726 | |
| AROON (14): | -35.714286 | |
| DEMA (21): | 0.106804 | |
| Parabolic SAR (0,02-0,02-0,2): | 0.104250 | |
| Elder Ray (13): | 0.000723 | |
| Super Trend (3,10): | 0.109526 | |
| Zig ZAG (10): | 0.107524 | |
| VORTEX (21): | 0.9582 | |
| Stochastique (14,3,5): | 71.46 | |
| TEMA (21): | 0.106905 | |
| Williams %R (14): | -19.44 | |
| Chande Momentum Oscillator (20): | -0.000346 | |
| Repulse (5,40,3): | 0.6671 | |
| ROCnROLL: | -1 | |
| TRIX (15,9): | -0.0280 | |
| Courbe Coppock: | 1.43 |
| MA7: | 0.109553 | |
| MA20: | 0.113989 | |
| MA50: | 0.135954 | |
| MA100: | 0.136757 | |
| MAexp7: | 0.107039 | |
| MAexp20: | 0.107130 | |
| MAexp50: | 0.107740 | |
| MAexp100: | 0.108542 | |
| Price / MA7: | -1.00% | |
| Price / MA20: | -4.86% | |
| Price / MA50: | -20.23% | |
| Price / MA100: | -20.70% | |
| Price / MAexp7: | +1.32% | |
| Price / MAexp20: | +1.23% | |
| Price / MAexp50: | +0.66% | |
| Price / MAexp100: | -0.08% |
About author

Online


Add a comment
Comments
0 comments on the analysis ALPHA FINANCE LAB - ALPHA/USDT - 1H