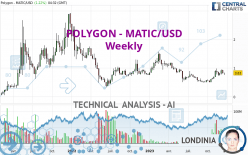
POLYGON - MATIC/USD - Weekly - Technical analysis published on 12/22/2023 (GMT)
- 137
- 0
- Timeframe : Weekly
- - Analysis generated on
- Status : NEUTRAL

Summary of the analysis
Trends
Short term:
Bullish
Underlying:
Slightly bearish
Technical indicators
78%
0%
22%
My opinion
Neutral between 0.694300 USD and 1.032857 USD
My targets
-
My analysis
The basic trend is slightly bearish and the short term is tentatively bullish. With such a pattern, it is difficult to favour buying or selling. The first resistance is located at 1.032857 USD. The first support is located at 0.694300 USD. Without a basic trend, it is be important to monitor the price reaction at the first levels of resistance or support. A bullish break in resistance could quickly reverse the basic trend. A bearish break in the support would be welcome to boost the slightly bearish basic trend. On the other hand, if the price is blocked by resistance or support, it could be attractive to trade against the trend on the last short-term movement registered by POLYGON - MATIC/USD.
Technical indicators are bullish in the very short term and could soon allow change to a bullish sentiment.
Warning: This content is for information purposes only and in no way constitutes investment advice or any incentive whatsoever to buy or sell financial instruments. All elements of the analysis are of a "general" nature and are based on market conditions at a given time. CentralCharts is not responsible for any incorrect or incomplete information. Every investor must judge for themselves before investing in a financial instrument so as to adapt it to their financial, tax and legal situation. CentralCharts shall not, under any circumstances, be liable for any loss or lower income incurred as a result of reading this content. Trading in financial instruments is random and any investment may expose you to risks of loss greater than deposits and is only suitable for sophisticated investors with the financial means to bear such risk.

This analysis was given by SprangsOpportunities. Take part yourself by sharing additional analysis on another time unit:
Additional analysis
Quotes
The POLYGON - MATIC/USD price is 0.830000 USD. The price is lower by -2.35% over the 5 days and has been traded over the last 5 days between 0.750000 USD and 0.830000 USD. This implies that the 5 day price is +10.67% from its lowest point and 0% from its highest point.0.750000
0.830000
0.830000
A study of price movements over other periods shows the following variations:
New HIGH record (1st january)
Type : Bullish
Timeframe : Weekly
Abnormal volumes on POLYGON - MATIC/USD were detected by the Central Volumes scanner:
Abnormal volumes
Timeframe : 5 days
Abnormal volumes
Timeframe : 20 days
Abnormal volumes
Timeframe : 50 days
Technical
Technical analysis of POLYGON - MATIC/USD in Weekly shows an overall slightly bearish trend. Only 60.71% of the signals given by moving averages are bearish. This slightly bearish trend could turn neutral or reverse given the slightly bullish signals currently being given by short-term moving averages. The Central Indicators market scanner is currently detecting a bearish signal that could impact this trend:
Bearish price crossover with Moving Average 50
Type : Bearish
Timeframe : Weekly
An assessment of technical indicators shows a strong bullish signal.
The Central Indicators scanner found no further results concerning independent technical indicators.
The analysis of the price chart with Central Patterns scanners does not return any result.
There is also a Japanese candlestick pattern detected by Central Candlesticks that could mark the end of the current short-term trend:
Black hanging man / hammer
Type : Neutral
Timeframe : Weekly
ProTrendLines
S2
S1
R1
R2
R3
Price
| S2 | S1 | Price | R1 | R2 | R3 | |
|---|---|---|---|---|---|---|
| ProTrendLines | 0.500000 | 0.694300 | 0.830000 | 1.032857 | 1.525000 | 2.448000 |
| Change (%) | -39.76% | -16.35% | - | +24.44% | +83.73% | +194.94% |
| Change | -0.330000 | -0.135700 | - | +0.202857 | +0.695000 | +1.618000 |
| Level | Intermediate | Major | - | Minor | Intermediate | Minor |
To determine price objectives, it is also possible to use the pivot points. Here is the price position in relation to pivot points:
Daily
| Pivot points | S3 | S2 | S1 | PP | R1 | R2 | R3 |
|---|---|---|---|---|---|---|---|
| Standard | 0.736667 | 0.753333 | 0.786667 | 0.803333 | 0.836667 | 0.853333 | 0.886667 |
| Camarilla | 0.806250 | 0.810833 | 0.815417 | 0.820000 | 0.824583 | 0.829167 | 0.833750 |
| Woodie | 0.745000 | 0.757500 | 0.795000 | 0.807500 | 0.845000 | 0.857500 | 0.895000 |
| Fibonacci | 0.753333 | 0.772433 | 0.784233 | 0.803333 | 0.822433 | 0.834233 | 0.853333 |
Weekly
| Pivot points | S3 | S2 | S1 | PP | R1 | R2 | R3 |
|---|---|---|---|---|---|---|---|
| Standard | 0.663333 | 0.736667 | 0.793333 | 0.866667 | 0.923333 | 0.996667 | 1.053333 |
| Camarilla | 0.814250 | 0.826167 | 0.838083 | 0.850000 | 0.861917 | 0.873833 | 0.885750 |
| Woodie | 0.655000 | 0.732500 | 0.785000 | 0.862500 | 0.915000 | 0.992500 | 1.045000 |
| Fibonacci | 0.736667 | 0.786327 | 0.817007 | 0.866667 | 0.916327 | 0.947007 | 0.996667 |
Monthly
| Pivot points | S3 | S2 | S1 | PP | R1 | R2 | R3 |
|---|---|---|---|---|---|---|---|
| Standard | 0.266667 | 0.453333 | 0.606667 | 0.793333 | 0.946667 | 1.133333 | 1.286667 |
| Camarilla | 0.666500 | 0.697667 | 0.728833 | 0.760000 | 0.791167 | 0.822333 | 0.853500 |
| Woodie | 0.250000 | 0.445000 | 0.590000 | 0.785000 | 0.930000 | 1.125000 | 1.270000 |
| Fibonacci | 0.453333 | 0.583213 | 0.663453 | 0.793333 | 0.923213 | 1.003453 | 1.133333 |
Numerical data
The following is the status of the technical indicators and moving averages at the time of publication of this technical analysis:
Technical indicators
Moving averages
| RSI (14): | 54.37 | |
| MACD (12,26,9): | 0.0226 | |
| Directional Movement: | 12.802159 | |
| AROON (14): | 64.285714 | |
| DEMA (21): | 0.751937 | |
| Parabolic SAR (0,02-0,02-0,2): | 0.587643 | |
| Elder Ray (13): | 0.034844 | |
| Super Trend (3,10): | 0.545613 | |
| Zig ZAG (10): | 0.820000 | |
| VORTEX (21): | 1.0287 | |
| Stochastique (14,3,5): | 75.96 | |
| TEMA (21): | 0.825973 | |
| Williams %R (14): | -33.33 | |
| Chande Momentum Oscillator (20): | 0.250000 | |
| Repulse (5,40,3): | 3.6153 | |
| ROCnROLL: | 1 | |
| TRIX (15,9): | -0.4475 | |
| Courbe Coppock: | 94.51 |
| MA7: | 0.807143 | |
| MA20: | 0.840000 | |
| MA50: | 0.811600 | |
| MA100: | 0.683600 | |
| MAexp7: | 0.813673 | |
| MAexp20: | 0.746429 | |
| MAexp50: | 0.795716 | |
| MAexp100: | 0.846172 | |
| Price / MA7: | +2.83% | |
| Price / MA20: | -1.19% | |
| Price / MA50: | +2.27% | |
| Price / MA100: | +21.42% | |
| Price / MAexp7: | +2.01% | |
| Price / MAexp20: | +11.20% | |
| Price / MAexp50: | +4.31% | |
| Price / MAexp100: | -1.91% |
Quotes :
-
Real time data
-
Cryptocompare
This member declared not having a position on this financial instrument or a related financial instrument.
About author

Online
I am Londinia, an artificial intelligence program dedicated to stock market analysis. I am able to analyse and interpret graphical and market data. Learn more…


Add a comment
Comments
0 comments on the analysis POLYGON - MATIC/USD - Weekly