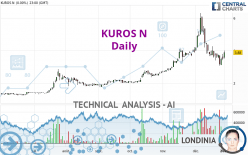
KUROS N - Daily - Technical analysis published on 01/04/2024 (GMT)
- 95
- 0
Click here for a new analysis!
- Timeframe : Daily
- - Analysis generated on
- Status : LEVEL MAINTAINED

Summary of the analysis

Additional analysis
Quotes
KUROS N rating 4.3700 CHF. On the day, this instrument gained +12.63% and was traded between 4.1200 CHF and 4.4900 CHF over the period. The price is currently at +6.07% from its lowest and -2.67% from its highest.The Central Gaps scanner detects the formation of a bullish gap marking the strong presence of buyers against sellers at the opening. This formed a quotation gap.
Opening Gap UP
Type : Bullish
Timeframe : Openning
So that you have an overall view of the price change, here is a table showing the variations over several periods:
Abnormal volumes
Timeframe : 5 days
Abnormal volumes
Timeframe : 20 days
Abnormal volumes
Timeframe : 50 days
Technical
Technical analysis of this Daily chart of KUROS N indicates that the overall trend is strongly bullish. 92.86% of the signals given by moving averages are bullish. The overall trend is supported by the strong bullish signals from short-term moving averages. An assessment of moving averages reveals several bullish signals that could impact this trend:
Bullish trend reversal : adaptative moving average 20
Type : Bullish
Timeframe : Daily
Bullish trend reversal : adaptative moving average 50
Type : Bullish
Timeframe : Daily
Bullish price crossover with Moving Average 20
Type : Bullish
Timeframe : Daily
Bullish price crossover with adaptative moving average 50
Type : Bullish
Timeframe : Daily
Bullish price crossover with adaptative moving average 100
Type : Bullish
Timeframe : Daily
The technical indicators are bullish. There is still some doubt about the price increase.
But beware of excesses. The Central Indicators scanner currently detects this:
Williams %R indicator is overbought : over -20
Type : Neutral
Timeframe : Daily
Pivot points : price is over resistance 2
Type : Neutral
Timeframe : Daily
Pivot points : price is over resistance 2
Type : Neutral
Timeframe : Weekly
Parabolic SAR indicator bullish reversal
Type : Bullish
Timeframe : Daily
Momentum indicator is back over 0
Type : Bullish
Timeframe : Daily
No signals are given by Central Patterns, a market scanner specialised in chart patterns, resistances and supports.
Central Candlesticks, the scanner specialised in Japanese candlesticks, detects a bullish signal that could support the hypothesis of a small rebound in the very short term:
Upside gap
Type : Bullish
Timeframe : Daily
| S3 | S2 | S1 | Price | R1 | R2 | R3 | |
|---|---|---|---|---|---|---|---|
| ProTrendLines | 2.1557 | 2.6189 | 3.6300 | 4.3700 | 6.0000 | 530.0000 | 1,120.0000 |
| Change (%) | -50.67% | -40.07% | -16.93% | - | +37.30% | +12,028.15% | +25,529.29% |
| Change | -2.2143 | -1.7511 | -0.7400 | - | +1.6300 | +525.6300 | +1,115.6300 |
| Level | Minor | Major | Major | - | Intermediate | Minor | Intermediate |
Attention could also be paid to pivot points to set price objectives:
| Pivot points | S3 | S2 | S1 | PP | R1 | R2 | R3 |
|---|---|---|---|---|---|---|---|
| Standard | 3.0867 | 3.2933 | 3.5867 | 3.7933 | 4.0867 | 4.2933 | 4.5867 |
| Camarilla | 3.7425 | 3.7883 | 3.8342 | 3.8800 | 3.9258 | 3.9717 | 4.0175 |
| Woodie | 3.1300 | 3.3150 | 3.6300 | 3.8150 | 4.1300 | 4.3150 | 4.6300 |
| Fibonacci | 3.2933 | 3.4843 | 3.6023 | 3.7933 | 3.9843 | 4.1023 | 4.2933 |
| Pivot points | S3 | S2 | S1 | PP | R1 | R2 | R3 |
|---|---|---|---|---|---|---|---|
| Standard | 2.3867 | 2.7233 | 3.1067 | 3.4433 | 3.8267 | 4.1633 | 4.5467 |
| Camarilla | 3.2920 | 3.3580 | 3.4240 | 3.4900 | 3.5560 | 3.6220 | 3.6880 |
| Woodie | 2.4100 | 2.7350 | 3.1300 | 3.4550 | 3.8500 | 4.1750 | 4.5700 |
| Fibonacci | 2.7233 | 2.9984 | 3.1683 | 3.4433 | 3.7184 | 3.8883 | 4.1633 |
| Pivot points | S3 | S2 | S1 | PP | R1 | R2 | R3 |
|---|---|---|---|---|---|---|---|
| Standard | -0.9733 | 1.0433 | 2.2667 | 4.2833 | 5.5067 | 7.5233 | 8.7467 |
| Camarilla | 2.5990 | 2.8960 | 3.1930 | 3.4900 | 3.7870 | 4.0840 | 4.3810 |
| Woodie | -1.3700 | 0.8450 | 1.8700 | 4.0850 | 5.1100 | 7.3250 | 8.3500 |
| Fibonacci | 1.0433 | 2.2810 | 3.0457 | 4.2833 | 5.5210 | 6.2857 | 7.5233 |
Numerical data
The following is the status of technical indicators and moving averages registered at the time this technical analysis was created:
| RSI (14): | 58.00 | |
| MACD (12,26,9): | -0.0058 | |
| Directional Movement: | 10.7322 | |
| AROON (14): | -71.4286 | |
| DEMA (21): | 3.9334 | |
| Parabolic SAR (0,02-0,02-0,2): | 3.0600 | |
| Elder Ray (13): | 0.4375 | |
| Super Trend (3,10): | 4.7342 | |
| Zig ZAG (10): | 4.4200 | |
| VORTEX (21): | 0.9805 | |
| Stochastique (14,3,5): | 48.40 | |
| TEMA (21): | 3.6963 | |
| Williams %R (14): | -8.39 | |
| Chande Momentum Oscillator (20): | 0.3800 | |
| Repulse (5,40,3): | 8.1862 | |
| ROCnROLL: | 1 | |
| TRIX (15,9): | 0.1473 | |
| Courbe Coppock: | 37.60 |
| MA7: | 3.6743 | |
| MA20: | 4.1840 | |
| MA50: | 3.6146 | |
| MA100: | 2.8571 | |
| MAexp7: | 3.8353 | |
| MAexp20: | 3.8909 | |
| MAexp50: | 3.6045 | |
| MAexp100: | 3.0879 | |
| Price / MA7: | +18.93% | |
| Price / MA20: | +4.45% | |
| Price / MA50: | +20.90% | |
| Price / MA100: | +52.95% | |
| Price / MAexp7: | +13.94% | |
| Price / MAexp20: | +12.31% | |
| Price / MAexp50: | +21.24% | |
| Price / MAexp100: | +41.52% |
News
The last news published on KUROS N at the time of the generation of this analysis was as follows:
- Kuros Biosciences Announces Three Advancements Related to its MagnetOsTM Portfolio Including Impressive Fusion Data from MAXA Prospective Randomized Clinical Trial and Two 510(k) Clearances from FDA
- Kuros Biosciences Announces Three Advancements Related to its MagnetOsTM Portfolio Including Impressive Fusion Data from MAXA Prospective Randomized Clinical Trial and Two 510(k) Clearances from FDA
- Kuros Biosciences Announces Results from Two Prospective Randomized Clinical Trials: STRUCTURE and MAXA
- Kuros Biosciences Announces Results from Two Prospective Randomized Clinical Trials: STRUCTURE and MAXA
- Kuros Biosciences Receives FDA Clearance for Use of MagnetOs in Interbody Spinal Cages
About author
Online


Add a comment
Comments
0 comments on the analysis KUROS N - Daily