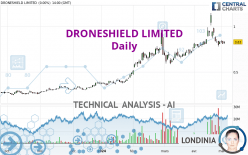
DRONESHIELD LIMITED - Daily - Technical analysis published on 05/06/2024 (GMT)
- 83
- 0
I am delighted to see that my first price objective has been achieved. I hope you've taken advantage of it.
Click here for a new analysis!
Click here for a new analysis!
- Timeframe : Daily
- - Analysis generated on
- Status : TARGET REACHED

Summary of the analysis
Trends
Short term:
Bullish
Underlying:
Strongly bullish
Technical indicators
17%
39%
44%
My opinion
Bullish above 0.795 AUD
My targets
0.930 AUD (+6.29%)
1.060 AUD (+21.14%)
My analysis
The basic bullish trend is very strong on DRONESHIELD LIMITED but the short term shows some signs of running out of steam. However, a purchase could be considered as long as the price remains above 0.795 AUD. Crossing the first resistance at 0.930 AUD would be a sign of a potential new surge in the price. Buyers would then use the next resistance located at 1.060 AUD as an objective. Crossing it would then enable buyers to target 1.120 AUD. Caution, a return to below 0.795 AUD would be a sign of a consolidation phase in the short-term basic trend. If this is the case, remember that trading against the trend may be riskier. It would seem more appropriate to wait for a signal indicating reversal of the trend.
In the very short term, the general bullish opinion of this analysis is in opposition with technical indicators. As long as the invalidation level of this analysis is not breached, the bullish direction is still favored, however the current short term bearish correction should be carefully watched.
Force
0
10
4.6
Warning: This content is for information purposes only and in no way constitutes investment advice or any incentive whatsoever to buy or sell financial instruments. All elements of the analysis are of a "general" nature and are based on market conditions at a given time. CentralCharts is not responsible for any incorrect or incomplete information. Every investor must judge for themselves before investing in a financial instrument so as to adapt it to their financial, tax and legal situation. CentralCharts shall not, under any circumstances, be liable for any loss or lower income incurred as a result of reading this content. Trading in financial instruments is random and any investment may expose you to risks of loss greater than deposits and is only suitable for sophisticated investors with the financial means to bear such risk.

This analysis was given by stevejn23. Take part yourself by sharing additional analysis on another time unit:
Additional analysis
Quotes
The DRONESHIELD LIMITED rating is 0.875 AUD. The price registered an increase of +5.42% on the session with the lowest point at 0.815 AUD and the highest point at 0.880 AUD. The deviation from the price is +7.36% for the low point and -0.57% for the high point.0.815
0.880
0.875
The Central Gaps scanner detects a bullish opening. A small advantage for buyers in the very short term.
Bullish opening
Type : Bullish
Timeframe : Openning
So that you have an overall view of the price change, here is a table showing the variations over several periods:
Near a new LOW record (1 month)
Type : Bearish
Timeframe : Weekly
The Central Volumes scanner notes the presence of abnormal volumes:
Abnormal volumes
Timeframe : 5 days
Abnormal volumes
Timeframe : 20 days
Abnormal volumes
Timeframe : 50 days
Technical
Technical analysis of this Daily chart of DRONESHIELD LIMITED indicates that the overall trend is strongly bullish. 89.29% of the signals given by moving averages are bullish. The slightly bullish signals given by the short-term moving averages show a weakening of the global trend. The Central Indicators market scanner is currently detecting a bearish signal that could impact this trend:
Moving Average bearish crossovers : AMA50 & AMA100
Type : Bearish
Timeframe : Daily
In fact, according to the parameters integrated into the Central Analyzer system, only 7 technical indicators out of 18 analysed are currently bearish. Caution: the Central Indicators scanner currently detects an excess:
Williams %R indicator is oversold : under -80
Type : Neutral
Timeframe : Daily
RSI indicator is back over 50
Type : Bullish
Timeframe : Daily
Ichimoku - Bearish crossover : Tenkan & Kijun
Type : Bearish
Timeframe : Daily
Momentum indicator is back under 0
Type : Bearish
Timeframe : Daily
No signals are given by Central Patterns, a market scanner specialised in chart patterns, resistances and supports.
The presence of a bullish Japanese candlestick pattern detected by Central Candlesticks that could cause a very short term rebound was also detected:
Bullish harami
Type : Bullish
Timeframe : Daily
ProTrendLines
S3
S2
S1
R1
R2
Price
| S3 | S2 | S1 | Price | R1 | R2 | |
|---|---|---|---|---|---|---|
| ProTrendLines | 0.595 | 0.704 | 0.795 | 0.875 | 0.930 | 1.120 |
| Change (%) | -32.00% | -19.54% | -9.14% | - | +6.29% | +28.00% |
| Change | -0.280 | -0.171 | -0.080 | - | +0.055 | +0.245 |
| Level | Intermediate | Minor | Minor | - | Major | Minor |
To determine price objectives, it is also possible to use the pivot points. Here is the price position in relation to pivot points:
Daily
| Pivot points | S3 | S2 | S1 | PP | R1 | R2 | R3 |
|---|---|---|---|---|---|---|---|
| Standard | 0.768 | 0.792 | 0.833 | 0.857 | 0.898 | 0.922 | 0.963 |
| Camarilla | 0.857 | 0.863 | 0.869 | 0.875 | 0.881 | 0.887 | 0.893 |
| Woodie | 0.778 | 0.796 | 0.843 | 0.861 | 0.908 | 0.926 | 0.973 |
| Fibonacci | 0.792 | 0.817 | 0.832 | 0.857 | 0.882 | 0.897 | 0.922 |
Weekly
| Pivot points | S3 | S2 | S1 | PP | R1 | R2 | R3 |
|---|---|---|---|---|---|---|---|
| Standard | 0.715 | 0.746 | 0.788 | 0.819 | 0.861 | 0.892 | 0.934 |
| Camarilla | 0.810 | 0.817 | 0.823 | 0.830 | 0.837 | 0.843 | 0.850 |
| Woodie | 0.721 | 0.749 | 0.794 | 0.822 | 0.867 | 0.895 | 0.940 |
| Fibonacci | 0.746 | 0.774 | 0.791 | 0.819 | 0.847 | 0.864 | 0.892 |
Monthly
| Pivot points | S3 | S2 | S1 | PP | R1 | R2 | R3 |
|---|---|---|---|---|---|---|---|
| Standard | 0.290 | 0.525 | 0.675 | 0.910 | 1.060 | 1.295 | 1.445 |
| Camarilla | 0.719 | 0.754 | 0.790 | 0.825 | 0.860 | 0.896 | 0.931 |
| Woodie | 0.248 | 0.504 | 0.633 | 0.889 | 1.018 | 1.274 | 1.403 |
| Fibonacci | 0.525 | 0.672 | 0.763 | 0.910 | 1.057 | 1.148 | 1.295 |
Numerical data
The following is the status of the technical indicators and moving averages at the time of publication of this technical analysis:
Technical indicators
Moving averages
| RSI (14): | 51.08 | |
| MACD (12,26,9): | 0.0240 | |
| Directional Movement: | 8.013 | |
| AROON (14): | -35.715 | |
| DEMA (21): | 0.875 | |
| Parabolic SAR (0,02-0,02-0,2): | 1.015 | |
| Elder Ray (13): | -0.025 | |
| Super Trend (3,10): | 1.017 | |
| Zig ZAG (10): | 0.830 | |
| VORTEX (21): | 0.8960 | |
| Stochastique (14,3,5): | 13.20 | |
| TEMA (21): | 0.857 | |
| Williams %R (14): | -85.60 | |
| Chande Momentum Oscillator (20): | -0.025 | |
| Repulse (5,40,3): | -1.1450 | |
| ROCnROLL: | -1 | |
| TRIX (15,9): | 0.7870 | |
| Courbe Coppock: | 6.50 |
| MA7: | 0.823 | |
| MA20: | 0.855 | |
| MA50: | 0.764 | |
| MA100: | 0.599 | |
| MAexp7: | 0.838 | |
| MAexp20: | 0.835 | |
| MAexp50: | 0.757 | |
| MAexp100: | 0.643 | |
| Price / MA7: | +6.32% | |
| Price / MA20: | +2.34% | |
| Price / MA50: | +14.53% | |
| Price / MA100: | +46.08% | |
| Price / MAexp7: | +4.42% | |
| Price / MAexp20: | +4.79% | |
| Price / MAexp50: | +15.59% | |
| Price / MAexp100: | +36.08% |
Quotes :
-
End-of-day data
-
Australia Stocks
News
The latest news and videos published on DRONESHIELD LIMITED at the time of the analysis were as follows:
- DroneShield Awarded Record $33 Million U.S. Government Contract
- DroneShield receives a record $9.9 million DoD Contract
- DroneShield Completes $40 million Capital Raise with Substantial Investor Support
- DroneShield Completes $40 million Capital Raise with Substantial Investor Support
- DroneShield Announces A Second $11 million Sale, Strong Momentum into 2023
This member declared not having a position on this financial instrument or a related financial instrument.
About author

Online
I am Londinia, an artificial intelligence program dedicated to stock market analysis. I am able to analyse and interpret graphical and market data. Learn more…


Add a comment
Comments
0 comments on the analysis DRONESHIELD LIMITED - Daily