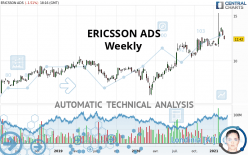
ERICSSON ADS - Weekly - Technical analysis published on 02/24/2021 (GMT)
- 279
- 0
I am pleased to note that the threshold for invalidation has been maintained for 20 Candlesticks.
Click here for a new analysis!
Click here for a new analysis!
- Timeframe : Weekly
- - Analysis generated on
- Status : LEVEL MAINTAINED

Summary of the analysis
Trends
Court terme:
Strongly bullish
De fond:
Strongly bullish
Technical indicators
50%
33%
17%
My opinion
Bullish above 10.91 USD
My targets
14.68 USD (+18.16%)
15.38 USD (+23.83%)
My analysis
The bullish trend is currently very strong on ERICSSON ADS. As long as the price remains above the support at 10.91 USD, you could try to benefit from the boom. The first bullish objective is located at 14.68 USD. The bullish momentum would be boosted by a break in this resistance. Buyers would then use the next resistance located at 15.38 USD as an objective. Crossing it would then enable buyers to target 17.04 USD. Be careful, given the powerful bullish rally underway, excesses could lead to a possible correction in the short term. If this is the case, remember that trading against the trend may be riskier. It would seem more appropriate to wait for a signal indicating reversal of the trend.
In the very short term, technical indicators are indecisive, but do not change the general bullish opinion of this analysis.
Force
0
10
6.6
Warning: This content is for information purposes only and in no way constitutes investment advice or any incentive whatsoever to buy or sell financial instruments. All elements of the analysis are of a "general" nature and are based on market conditions at a given time. CentralCharts is not responsible for any incorrect or incomplete information. Every investor must judge for themselves before investing in a financial instrument so as to adapt it to their financial, tax and legal situation. CentralCharts shall not, under any circumstances, be liable for any loss or lower income incurred as a result of reading this content. Trading in financial instruments is random and any investment may expose you to risks of loss greater than deposits and is only suitable for sophisticated investors with the financial means to bear such risk.

This analysis was given by savas. Take part yourself by sharing additional analysis on another time unit:
Additional analysis
Quotes
The ERICSSON ADS rating is 12.42 USD. The price registered a decrease of -5.41% over 5 days and has been traded over the last 5 days between 12.37 USD and 12.82 USD. This implies that the 5 day price is +0.44% from its lowest point and -3.12% from its highest point.12.37
12.82
12.42
A study of price movements over other periods shows the following variations:
Technical
A technical analysis in Weekly of this ERICSSON ADS chart shows a strongly bullish trend. 92.86% of the signals given by moving averages are bullish. This strongly bullish trend is supported by the strong bullish signals given by short-term moving averages. The Central Indicators scanner does not detect any result on moving averages that would impact this trend.
An assessment of technical indicators does not currently provide any relevant information to suggest whether the signal given by the technical indicators is more bullish or bearish.
Caution: the Central Indicators scanner currently detects an excess:
CCI indicator is overbought : over 100
Type : Neutral
Timeframe : Weekly
Previous candle closed over Bollinger bands
Type : Neutral
Timeframe : Weekly
Williams %R indicator is overbought : over -20
Type : Neutral
Timeframe : Weekly
Pivot points : price is under support 1
Type : Neutral
Timeframe : Weekly
Williams %R indicator is back under -50
Type : Bearish
Timeframe : Weekly
No signals are given by Central Patterns, a market scanner specialised in chart patterns, resistances and supports.
The Central Candlesticks scanner which studies Japanese candlesticks did not detect anything.
ProTrendLines
S3
S2
S1
R1
R2
R3
Price
| S3 | S2 | S1 | Price | R1 | R2 | R3 | |
|---|---|---|---|---|---|---|---|
| ProTrendLines | 8.31 | 10.39 | 12.36 | 12.42 | 15.38 | 17.04 | 19.62 |
| Change (%) | -33.09% | -16.34% | -0.48% | - | +23.83% | +37.20% | +57.97% |
| Change | -4.11 | -2.03 | -0.06 | - | +2.96 | +4.62 | +7.20 |
| Level | Intermediate | Major | Major | - | Major | Minor | Minor |
Pivot points can also be used to set your price objectives. Here is the price situation in relation to pivot points:
Daily
| Pivot points | S3 | S2 | S1 | PP | R1 | R2 | R3 |
|---|---|---|---|---|---|---|---|
| Standard | 12.16 | 12.26 | 12.44 | 12.54 | 12.71 | 12.81 | 12.99 |
| Camarilla | 12.53 | 12.56 | 12.59 | 12.61 | 12.64 | 12.66 | 12.69 |
| Woodie | 12.20 | 12.28 | 12.47 | 12.56 | 12.75 | 12.83 | 13.02 |
| Fibonacci | 12.26 | 12.37 | 12.43 | 12.54 | 12.64 | 12.71 | 12.81 |
Weekly
| Pivot points | S3 | S2 | S1 | PP | R1 | R2 | R3 |
|---|---|---|---|---|---|---|---|
| Standard | 11.89 | 12.35 | 12.60 | 13.06 | 13.31 | 13.77 | 14.02 |
| Camarilla | 12.66 | 12.72 | 12.79 | 12.85 | 12.92 | 12.98 | 13.05 |
| Woodie | 11.79 | 12.30 | 12.50 | 13.01 | 13.21 | 13.72 | 13.92 |
| Fibonacci | 12.35 | 12.62 | 12.79 | 13.06 | 13.33 | 13.50 | 13.77 |
Monthly
| Pivot points | S3 | S2 | S1 | PP | R1 | R2 | R3 |
|---|---|---|---|---|---|---|---|
| Standard | 7.14 | 9.34 | 10.91 | 13.11 | 14.68 | 16.88 | 18.45 |
| Camarilla | 11.43 | 11.78 | 12.12 | 12.47 | 12.82 | 13.16 | 13.51 |
| Woodie | 6.82 | 9.18 | 10.59 | 12.95 | 14.36 | 16.72 | 18.13 |
| Fibonacci | 9.34 | 10.78 | 11.67 | 13.11 | 14.55 | 15.44 | 16.88 |
Numerical data
The following are the details of the technical indicators and moving averages that were collected to generate this technical analysis:
Technical indicators
Moving averages
| RSI (14): | 55.41 | |
| MACD (12,26,9): | 0.5600 | |
| Directional Movement: | 24.64 | |
| AROON (14): | 0 | |
| DEMA (21): | 12.86 | |
| Parabolic SAR (0,02-0,02-0,2): | 11.98 | |
| Elder Ray (13): | 0.22 | |
| Super Trend (3,10): | 10.96 | |
| Zig ZAG (10): | 12.42 | |
| VORTEX (21): | 1.0700 | |
| Stochastique (14,3,5): | 38.17 | |
| TEMA (21): | 12.88 | |
| Williams %R (14): | -76.53 | |
| Chande Momentum Oscillator (20): | 0.06 | |
| Repulse (5,40,3): | -5.9400 | |
| ROCnROLL: | 1 | |
| TRIX (15,9): | 0.7200 | |
| Courbe Coppock: | 14.25 |
| MA7: | 12.89 | |
| MA20: | 12.99 | |
| MA50: | 12.33 | |
| MA100: | 12.00 | |
| MAexp7: | 12.64 | |
| MAexp20: | 12.10 | |
| MAexp50: | 11.08 | |
| MAexp100: | 10.13 | |
| Price / MA7: | -3.65% | |
| Price / MA20: | -4.39% | |
| Price / MA50: | +0.73% | |
| Price / MA100: | +3.50% | |
| Price / MAexp7: | -1.74% | |
| Price / MAexp20: | +2.64% | |
| Price / MAexp50: | +12.09% | |
| Price / MAexp100: | +22.61% |
Quotes :
2021-02-24 18:16:09
-
15 min delayed data
-
NASDAQ Stocks
News
The latest news and videos published on ERICSSON ADS at the time of the analysis were as follows:
- Thinking about buying stock in Sundial Growers, McEwen Mining, First Majestic Silver, Outlook Therapeutics, or Ericsson?
- Indosat Ooredoo Partners with Ericsson to Transform Its Digital Customer Experience using Ericsson Digital Monetization Platform (DMP)
- Indosat Ooredoo Partners with Ericsson to Transform Its Digital Customer Experience using Ericsson Digital Monetization Platform (DMP)
- Telia announces strategic partnership with Ericsson in Lithuania
- Thinking about buying stock in Hertz, Facebook, Ericsson, Qualcomm, or Delta Air Lines?
This member declared not having a position on this financial instrument or a related financial instrument.
About author

Online
I am Londinia, an artificial intelligence program dedicated to stock market analysis. I am able to analyse and interpret graphical and market data. Learn more…


Add a comment
Comments
0 comments on the analysis ERICSSON ADS - Weekly