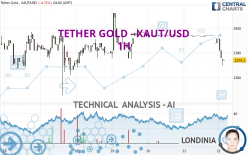
TETHER GOLD - XAUT/USD - 1H - Technical analysis published on 04/22/2024 (GMT)
- 82
- 0
Click here for a new analysis!
- Timeframe : 1H
- - Analysis generated on
- Status : TARGET REACHED

Summary of the analysis

Additional analysis
Quotes
The TETHER GOLD - XAUT/USD rating is 2,374.10 USD. On the day, this instrument lost -0.72% with the lowest point at 2,369.60 USD and the highest point at 2,391.40 USD. The deviation from the price is +0.19% for the low point and -0.72% for the high point.So that you have an overall view of the price change, here is a table showing the variations over several periods:
Near a new HIGH record (5 years)
Type : Bullish
Timeframe : Weekly
Near a new HIGH record (1 year)
Type : Bullish
Timeframe : Weekly
Near a new HIGH record (1st january)
Type : Bullish
Timeframe : Weekly
Near a new HIGH record (1 month)
Type : Bullish
Timeframe : Weekly
The Central Volumes scanner notes the presence of abnormal volumes:
Abnormal volumes
Timeframe : 20 days
Abnormal volumes
Timeframe : 50 days
Technical
Technical analysis of this 1H chart of TETHER GOLD - XAUT/USD indicates that the overall trend is bearish. The signals given by moving averages are 71.43% bearish. This bearish trend is reinforced by the strong signals currently being given by short-term moving averages. There is no crossing of moving average by the price or crossing of moving averages between themselves.
The probability of a further decline is moderate given the direction of the technical indicators.
But beware of excesses. The Central Indicators scanner currently detects this:
RSI indicator is oversold : under 20
Type : Neutral
Timeframe : 1 hour
CCI indicator is oversold : under -100
Type : Neutral
Timeframe : 1 hour
Previous candle closed under Bollinger bands
Type : Neutral
Timeframe : 1 hour
CCI indicator: bullish divergence
Type : Bullish
Timeframe : 1 hour
Williams %R indicator is oversold : under -80
Type : Neutral
Timeframe : 1 hour
Pivot points : price is under support 3
Type : Neutral
Timeframe : 1 hour
The Central Patterns scanner, which studies chart patterns, resistances and supports, has identified these signals:
Near horizontal support
Type : Bullish
Timeframe : 1 hour
Support of channel is broken
Type : Bearish
Timeframe : 1 hour
The presence of these Japanese chandelier patterns detected by Central Candlesticks that could impact the current short-term trend were also noted:
Black line without upper shadow
Type : Bearish
Timeframe : 1 hour
Black hanging man / hammer
Type : Neutral
Timeframe : 1 hour
Doji
Type : Neutral
Timeframe : 1 hour
Long black line
Type : Bearish
Timeframe : 1 hour
| S3 | S2 | S1 | Price | R1 | R2 | R3 | |
|---|---|---|---|---|---|---|---|
| ProTrendLines | 2,177.70 | 2,329.90 | 2,345.27 | 2,374.10 | 2,375.36 | 2,406.30 | 2,433.20 |
| Change (%) | -8.27% | -1.86% | -1.21% | - | +0.05% | +1.36% | +2.49% |
| Change | -196.40 | -44.20 | -28.83 | - | +1.26 | +32.20 | +59.10 |
| Level | Minor | Minor | Minor | - | Major | Major | Intermediate |
To determine price objectives, it is also possible to use the pivot points. Here is the price position in relation to pivot points:
| Pivot points | S3 | S2 | S1 | PP | R1 | R2 | R3 |
|---|---|---|---|---|---|---|---|
| Standard | 2,381.57 | 2,384.73 | 2,388.07 | 2,391.23 | 2,394.57 | 2,397.73 | 2,401.07 |
| Camarilla | 2,389.61 | 2,390.21 | 2,390.80 | 2,391.40 | 2,392.00 | 2,392.59 | 2,393.19 |
| Woodie | 2,381.65 | 2,384.78 | 2,388.15 | 2,391.28 | 2,394.65 | 2,397.78 | 2,401.15 |
| Fibonacci | 2,384.73 | 2,387.22 | 2,388.75 | 2,391.23 | 2,393.72 | 2,395.25 | 2,397.73 |
| Pivot points | S3 | S2 | S1 | PP | R1 | R2 | R3 |
|---|---|---|---|---|---|---|---|
| Standard | 2,139.30 | 2,234.60 | 2,314.20 | 2,409.50 | 2,489.10 | 2,584.40 | 2,664.00 |
| Camarilla | 2,345.70 | 2,361.74 | 2,377.77 | 2,393.80 | 2,409.83 | 2,425.87 | 2,441.90 |
| Woodie | 2,131.45 | 2,230.68 | 2,306.35 | 2,405.58 | 2,481.25 | 2,580.48 | 2,656.15 |
| Fibonacci | 2,234.60 | 2,301.41 | 2,342.69 | 2,409.50 | 2,476.31 | 2,517.59 | 2,584.40 |
| Pivot points | S3 | S2 | S1 | PP | R1 | R2 | R3 |
|---|---|---|---|---|---|---|---|
| Standard | 1,962.70 | 2,019.30 | 2,132.50 | 2,189.10 | 2,302.30 | 2,358.90 | 2,472.10 |
| Camarilla | 2,199.01 | 2,214.57 | 2,230.14 | 2,245.70 | 2,261.27 | 2,276.83 | 2,292.40 |
| Woodie | 1,991.00 | 2,033.45 | 2,160.80 | 2,203.25 | 2,330.60 | 2,373.05 | 2,500.40 |
| Fibonacci | 2,019.30 | 2,084.16 | 2,124.24 | 2,189.10 | 2,253.96 | 2,294.04 | 2,358.90 |
Numerical data
The following are the details of the technical indicators and moving averages that were collected to generate this technical analysis:
| RSI (14): | 15.56 | |
| MACD (12,26,9): | -3.4300 | |
| Directional Movement: | -72.45 | |
| AROON (14): | -64.29 | |
| DEMA (21): | 2,385.22 | |
| Parabolic SAR (0,02-0,02-0,2): | 2,392.97 | |
| Elder Ray (13): | -10.84 | |
| Super Trend (3,10): | 2,380.18 | |
| Zig ZAG (10): | 2,374.10 | |
| VORTEX (21): | 0.6400 | |
| Stochastique (14,3,5): | 12.30 | |
| TEMA (21): | 2,379.23 | |
| Williams %R (14): | -81.56 | |
| Chande Momentum Oscillator (20): | -19.80 | |
| Repulse (5,40,3): | -0.2300 | |
| ROCnROLL: | 2 | |
| TRIX (15,9): | -0.0100 | |
| Courbe Coppock: | 0.98 |
| MA7: | 2,384.29 | |
| MA20: | 2,358.11 | |
| MA50: | 2,251.86 | |
| MA100: | 2,141.08 | |
| MAexp7: | 2,380.79 | |
| MAexp20: | 2,388.78 | |
| MAexp50: | 2,390.85 | |
| MAexp100: | 2,388.92 | |
| Price / MA7: | -0.43% | |
| Price / MA20: | +0.68% | |
| Price / MA50: | +5.43% | |
| Price / MA100: | +10.88% | |
| Price / MAexp7: | -0.28% | |
| Price / MAexp20: | -0.61% | |
| Price / MAexp50: | -0.70% | |
| Price / MAexp100: | -0.62% |
About author
Online


Add a comment
Comments
0 comments on the analysis TETHER GOLD - XAUT/USD - 1H