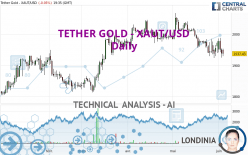
TETHER GOLD - XAUT/USD - Daily - Technical analysis published on 06/04/2023 (GMT)
- 131
- 0
Click here for a new analysis!
- Timeframe : Daily
- - Analysis generated on
- Status : LEVEL MAINTAINED

Summary of the analysis

Additional analysis
Quotes
The TETHER GOLD - XAUT/USD rating is 1,937.43 USD. The price is lower by -0.05% since the last closing and was traded between 1,929.46 USD and 1,953.28 USD over the period. The price is currently at +0.41% from its lowest and -0.81% from its highest.The Central Gaps scanner detects a bullish opening marking the presence of buyers ahead of sellers at the opening but not sufficiently marked to allow the price to register a quotation gap.
Bullish opening
Type : Bullish
Timeframe : Openning
A study of price movements over other periods shows the following variations:
Near a new HIGH record (1 year)
Type : Bullish
Timeframe : Weekly
Near a new HIGH record (1st january)
Type : Bullish
Timeframe : Weekly
Technical
Technical analysis of TETHER GOLD - XAUT/USD in Daily shows an overall bearish trend. 71.43% of the signals given by moving averages are bearish. The overall trend is reinforced by the strong bearish signals from short-term moving averages. The Central Indicators scanner detects bearish signals on moving averages that could impact this trend:
Bearish price crossover with Moving Average 20
Type : Bearish
Timeframe : Daily
Bearish price crossover with Moving Average 100
Type : Bearish
Timeframe : Daily
Bearish price crossover with adaptative moving average 20
Type : Bearish
Timeframe : Daily
Bearish price crossover with adaptative moving average 100
Type : Bearish
Timeframe : Daily
An assessment of technical indicators does not currently provide any relevant information on the direction of future price movements.
But beware of excesses. The Central Indicators scanner currently detects this:
CCI indicator is oversold : under -100
Type : Neutral
Timeframe : Daily
CCI indicator: bullish divergence
Type : Bullish
Timeframe : Daily
Pivot points : price is under support 1
Type : Neutral
Timeframe : Daily
RSI indicator is back under 50
Type : Bearish
Timeframe : Daily
Aroon indicator bullish trend
Type : Bullish
Timeframe : Daily
Price is back under the pivot point
Type : Bearish
Timeframe : Weekly
Momentum indicator is back under 0
Type : Bearish
Timeframe : Daily
Williams %R indicator is back under -50
Type : Bearish
Timeframe : Daily
An analysis of the price chart with the Central Patterns scanner (detector of chart patterns and resistances and supports) shows a result that can have an impact on the price change:
Near horizontal support
Type : Bullish
Timeframe : Daily
Central Candlesticks, the scanner specialised in Japanese candlesticks, detects a bearish signal that could support the hypothesis of a small drop in the very short term:
Bearish engulfing lines
Type : Bearish
Timeframe : Daily
| S3 | S2 | S1 | Price | R1 | R2 | R3 | |
|---|---|---|---|---|---|---|---|
| ProTrendLines | 1,792.67 | 1,819.67 | 1,876.86 | 1,937.43 | 1,952.55 | 1,984.77 | 2,021.30 |
| Change (%) | -7.47% | -6.08% | -3.13% | - | +0.78% | +2.44% | +4.33% |
| Change | -144.76 | -117.76 | -60.57 | - | +15.12 | +47.34 | +83.87 |
| Level | Minor | Major | Intermediate | - | Major | Major | Minor |
To determine price objectives, it is also possible to use the pivot points. Here is the price position in relation to pivot points:
| Pivot points | S3 | S2 | S1 | PP | R1 | R2 | R3 |
|---|---|---|---|---|---|---|---|
| Standard | 1,893.01 | 1,908.67 | 1,923.52 | 1,939.18 | 1,954.03 | 1,969.69 | 1,984.54 |
| Camarilla | 1,929.98 | 1,932.78 | 1,935.57 | 1,938.37 | 1,941.17 | 1,943.96 | 1,946.76 |
| Woodie | 1,892.61 | 1,908.47 | 1,923.12 | 1,938.98 | 1,953.63 | 1,969.49 | 1,984.14 |
| Fibonacci | 1,908.67 | 1,920.33 | 1,927.53 | 1,939.18 | 1,950.84 | 1,958.04 | 1,969.69 |
| Pivot points | S3 | S2 | S1 | PP | R1 | R2 | R3 |
|---|---|---|---|---|---|---|---|
| Standard | 1,846.93 | 1,885.34 | 1,911.85 | 1,950.26 | 1,976.77 | 2,015.18 | 2,041.69 |
| Camarilla | 1,920.52 | 1,926.47 | 1,932.42 | 1,938.37 | 1,944.32 | 1,950.27 | 1,956.22 |
| Woodie | 1,840.99 | 1,882.37 | 1,905.91 | 1,947.29 | 1,970.83 | 2,012.21 | 2,035.75 |
| Fibonacci | 1,885.34 | 1,910.14 | 1,925.46 | 1,950.26 | 1,975.06 | 1,990.38 | 2,015.18 |
| Pivot points | S3 | S2 | S1 | PP | R1 | R2 | R3 |
|---|---|---|---|---|---|---|---|
| Standard | 1,763.55 | 1,843.64 | 1,908.15 | 1,988.24 | 2,052.75 | 2,132.84 | 2,197.35 |
| Camarilla | 1,932.89 | 1,946.14 | 1,959.40 | 1,972.65 | 1,985.91 | 1,999.16 | 2,012.42 |
| Woodie | 1,755.75 | 1,839.75 | 1,900.35 | 1,984.35 | 2,044.95 | 2,128.95 | 2,189.55 |
| Fibonacci | 1,843.64 | 1,898.88 | 1,933.01 | 1,988.24 | 2,043.48 | 2,077.61 | 2,132.84 |
Numerical data
The following is the status of the technical indicators and moving averages at the time of publication of this technical analysis:
| RSI (14): | 38.37 | |
| MACD (12,26,9): | -13.1600 | |
| Directional Movement: | -5.25 | |
| AROON (14): | 28.57 | |
| DEMA (21): | 1,948.00 | |
| Parabolic SAR (0,02-0,02-0,2): | 1,988.66 | |
| Elder Ray (13): | -14.66 | |
| Super Trend (3,10): | 2,009.48 | |
| Zig ZAG (10): | 1,937.43 | |
| VORTEX (21): | 0.8700 | |
| Stochastique (14,3,5): | 32.68 | |
| TEMA (21): | 1,940.78 | |
| Williams %R (14): | -65.37 | |
| Chande Momentum Oscillator (20): | -30.32 | |
| Repulse (5,40,3): | -0.2300 | |
| ROCnROLL: | 2 | |
| TRIX (15,9): | -0.1000 | |
| Courbe Coppock: | 2.69 |
| MA7: | 1,952.81 | |
| MA20: | 1,961.48 | |
| MA50: | 1,988.71 | |
| MA100: | 1,962.74 | |
| MAexp7: | 1,951.95 | |
| MAexp20: | 1,963.23 | |
| MAexp50: | 1,974.35 | |
| MAexp100: | 1,954.03 | |
| Price / MA7: | -0.79% | |
| Price / MA20: | -1.23% | |
| Price / MA50: | -2.58% | |
| Price / MA100: | -1.29% | |
| Price / MAexp7: | -0.74% | |
| Price / MAexp20: | -1.31% | |
| Price / MAexp50: | -1.87% | |
| Price / MAexp100: | -0.85% |
About author
Online


Add a comment
Comments
0 comments on the analysis TETHER GOLD - XAUT/USD - Daily