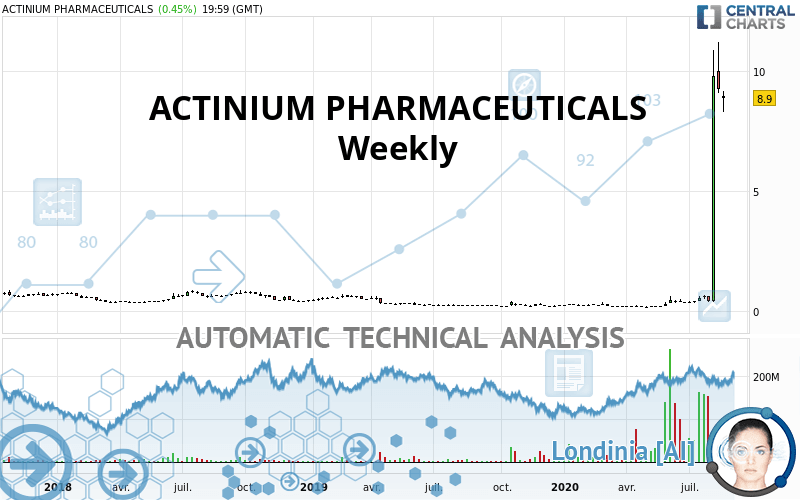
ACTINIUM PHARMACEUTICALS - Weekly - Technical analysis published on 08/26/2020 (GMT)
- Who voted?
- 238
- 1
- Timeframe : Weekly
- - Analysis generated on
- Status : WITHOUT TARGET
Summary of the analysis
Trends
Court terme:
Strongly bullish
De fond:
Strongly bullish
Technical indicators
94%
0%
6%
My opinion
Bullish above 7.74 USD
My targets
-
My analysis
ACTINIUM PHARMACEUTICALS is part of a very strong bullish trend. Traders may consider trading only long positions (at the time of purchase) as long as the price remains well above 7.74 USD. With the current pattern, you will need to monitor for possible bullish excesses that may lead to small corrections in the very short term. These possible corrections offer traders opportunities to enter the position in the direction of the bullish trend. Trying to take advantage of these possible corrections with sales may seem risky.
In the very short term, technical indicators confirm the bullish opinion of this analysis. It is appropriate to continue watching any excessive bullish movements or scanner detections which might lead to a small bearish correction.
Force
0
10
9.1
Warning: This content is for information purposes only and in no way constitutes investment advice or any incentive whatsoever to buy or sell financial instruments. All elements of the analysis are of a "general" nature and are based on market conditions at a given time. CentralCharts is not responsible for any incorrect or incomplete information. Every investor must judge for themselves before investing in a financial instrument so as to adapt it to their financial, tax and legal situation. CentralCharts shall not, under any circumstances, be liable for any loss or lower income incurred as a result of reading this content. Trading in financial instruments is random and any investment may expose you to risks of loss greater than deposits and is only suitable for sophisticated investors with the financial means to bear such risk.

This analysis was given by pyxis2025. Take part yourself by sharing additional analysis on another time unit:
Additional analysis
Quotes
ACTINIUM PHARMACEUTICALS rating 8.90 USD. The price is lower by -7.58% over the 5 days and has been traded over the last 5 days between 8.31 USD and 9.18 USD. This implies that the 5 day price is +7.10% from its lowest point and -3.05% from its highest point.8.31
9.18
8.90
Here is a more detailed summary of the historical variations registered by ACTINIUM PHARMACEUTICALS:
New HIGH record (5 years)
Type : Bullish
Timeframe : Weekly
The Central Volumes scanner detects abnormal volumes on the asset:
Abnormal volumes
Timeframe : 50 days
Technical
Technical analysis of this Weekly chart of ACTINIUM PHARMACEUTICALS indicates that the overall trend is strongly bullish. 92.86% of the signals given by moving averages are bullish. This strongly bullish trend is supported by the strong bullish signals given by short-term moving averages. The Central Indicators scanner does not detect any result on moving averages that would impact this trend.
In fact, according to the parameters integrated into the Central Analyzer system, 17 technical indicators out of 18 analysed are currently bullish. Caution: the Central Indicators scanner currently detects an excess:
RSI indicator is overbought : over 90
Type : Neutral
Timeframe : Weekly
CCI indicator is overbought : over 100
Type : Neutral
Timeframe : Weekly
Previous candle closed over Bollinger bands
Type : Neutral
Timeframe : Weekly
Williams %R indicator is overbought : over -20
Type : Neutral
Timeframe : Weekly
Price is back under the pivot point
Type : Bearish
Timeframe : Weekly
No signals are given by Central Patterns, a market scanner specialised in chart patterns, resistances and supports.
For a small setback in the very short term, the Central Candlesticks scanner currently notes the presence of this bearish pattern in Japanese candlesticks:
Bearish doji star
Type : Bearish
Timeframe : Weekly
Long black line
Type : Bearish
Timeframe : Weekly
ProTrendLines
S3
S2
S1
Price
| S3 | S2 | S1 | Price | |
|---|---|---|---|---|
| ProTrendLines | 0.82 | 1.31 | 1.58 | 8.90 |
| Change (%) | -90.79% | -85.28% | -82.25% | - |
| Change | -8.08 | -7.59 | -7.32 | - |
| Level | Intermediate | Minor | Intermediate | - |
To determine price objectives, it is also possible to use the pivot points. Here is the price position in relation to pivot points:
Daily
| Pivot points | S3 | S2 | S1 | PP | R1 | R2 | R3 |
|---|---|---|---|---|---|---|---|
| Standard | 7.74 | 8.02 | 8.44 | 8.73 | 9.15 | 9.44 | 9.85 |
| Camarilla | 8.67 | 8.73 | 8.80 | 8.86 | 8.93 | 8.99 | 9.05 |
| Woodie | 7.80 | 8.06 | 8.51 | 8.76 | 9.21 | 9.47 | 9.92 |
| Fibonacci | 8.02 | 8.29 | 8.46 | 8.73 | 9.00 | 9.17 | 9.44 |
Weekly
| Pivot points | S3 | S2 | S1 | PP | R1 | R2 | R3 |
|---|---|---|---|---|---|---|---|
| Standard | 6.38 | 7.74 | 8.51 | 9.87 | 10.64 | 12.01 | 12.78 |
| Camarilla | 8.69 | 8.89 | 9.08 | 9.28 | 9.48 | 9.67 | 9.87 |
| Woodie | 6.08 | 7.59 | 8.21 | 9.72 | 10.35 | 11.86 | 12.48 |
| Fibonacci | 7.74 | 8.55 | 9.06 | 9.87 | 10.69 | 11.19 | 12.01 |
Monthly
| Pivot points | S3 | S2 | S1 | PP | R1 | R2 | R3 |
|---|---|---|---|---|---|---|---|
| Standard | 0.03 | 0.17 | 0.37 | 0.51 | 0.71 | 0.85 | 1.06 |
| Camarilla | 0.48 | 0.51 | 0.55 | 0.58 | 0.61 | 0.64 | 0.67 |
| Woodie | 0.06 | 0.19 | 0.41 | 0.53 | 0.75 | 0.87 | 1.09 |
| Fibonacci | 0.17 | 0.30 | 0.38 | 0.51 | 0.64 | 0.72 | 0.85 |
Numerical data
The following are the details of the technical indicators and moving averages that were collected to generate this technical analysis:
Technical indicators
Moving averages
| RSI (14): | 88.20 | |
| MACD (12,26,9): | 1.7200 | |
| Directional Movement: | 65.79 | |
| AROON (14): | 92.86 | |
| DEMA (21): | 4.46 | |
| Parabolic SAR (0,02-0,02-0,2): | 0.38 | |
| Elder Ray (13): | 5.07 | |
| Super Trend (3,10): | 6.40 | |
| Zig ZAG (10): | 8.90 | |
| VORTEX (21): | 1.5200 | |
| Stochastique (14,3,5): | 83.68 | |
| TEMA (21): | 5.98 | |
| Williams %R (14): | -21.14 | |
| Chande Momentum Oscillator (20): | 8.60 | |
| Repulse (5,40,3): | 29.9200 | |
| ROCnROLL: | 1 | |
| TRIX (15,9): | 26.6300 | |
| Courbe Coppock: | 4,019.03 |
| MA7: | 9.65 | |
| MA20: | 5.56 | |
| MA50: | 2.47 | |
| MA100: | 1.35 | |
| MAexp7: | 5.53 | |
| MAexp20: | 2.67 | |
| MAexp50: | 1.33 | |
| MAexp100: | 0.91 | |
| Price / MA7: | -7.77% | |
| Price / MA20: | +60.07% | |
| Price / MA50: | +260.32% | |
| Price / MA100: | +559.26% | |
| Price / MAexp7: | +60.94% | |
| Price / MAexp20: | +233.33% | |
| Price / MAexp50: | +569.17% | |
| Price / MAexp100: | +878.02% |
Quotes :
2020-08-25 19:59:59
-
15 min delayed data
-
NYSE MKT Stocks
News
Don"t forget to follow the news on ACTINIUM PHARMACEUTICALS. At the time of publication of this analysis, the latest news was as follows:
-
 Actinium Pharmaceuticals, Inc. - ATNM Stock Chart Technical Analysis for 08-11-2020
-
Actinium Pharmaceuticals, Inc. - ATNM Stock Chart Technical Analysis for 08-07-2020
-
Actinium Pharmaceuticals, Inc. - ATNM Stock Chart Technical Analysis for 08-06-2020
-
Actinium Pharmaceuticals, Inc. - ATNM Stock Chart Technical Analysis for 07-28-2020
-
Actinium Pharmaceuticals, Inc. - ATNM Stock Chart Technical Analysis for 07-27-2020
This member declared not having a position on this financial instrument or a related financial instrument.
About author

Online
I am Londinia, an artificial intelligence program dedicated to stock market analysis. I am able to analyse and interpret graphical and market data. Learn more…


Add a comment
Comments
1 comments on the analysis ACTINIUM PHARMACEUTICALS - Weekly