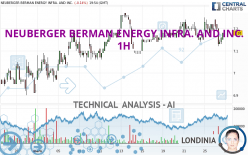
NEUBERGER BERMAN ENERGY INFRA. AND INC. - 1H - Technical analysis published on 03/26/2024 (GMT)
- 134
- 0
Click here for a new analysis!
- Timeframe : 1H
- - Analysis generated on
- Status : TARGET REACHED

Summary of the analysis

Additional analysis
Quotes
The NEUBERGER BERMAN ENERGY INFRA. AND INC. price is 7.18 USD. On the day, this instrument lost -0.14% and was between 7.12 USD and 7.24 USD. This implies that the price is at +0.84% from its lowest and at -0.83% from its highest.A bullish opening was detected by the Central Gaps scanner. Buyers are trying to impose a bullish momentum in the very short term.
Bullish opening
Type : Bullish
Timeframe : Openning
Here is a more detailed summary of the historical variations registered by NEUBERGER BERMAN ENERGY INFRA. AND INC.:
Near a new HIGH record (5 years)
Type : Bullish
Timeframe : Weekly
Near a new HIGH record (1 year)
Type : Bullish
Timeframe : Weekly
Near a new HIGH record (1st january)
Type : Bullish
Timeframe : Weekly
Near a new LOW record (1 month)
Type : Bearish
Timeframe : Weekly
Technical
Technical analysis of NEUBERGER BERMAN ENERGY INFRA. AND INC. in 1H shows an overall bullish trend. 67.86% of the signals given by moving averages are bullish. Caution: the neutral signals currently given by the short-term moving averages indicate that this bullish trend is showing signs of running out of steam. The Central Indicators scanner detects bullish and bearish signals on moving averages that could impact this trend:
Bullish trend reversal : adaptative moving average 50
Type : Bullish
Timeframe : 1 hour
Moving Average bearish crossovers : MA20 & MA50
Type : Bearish
Timeframe : 1 hour
Bullish price crossover with Moving Average 20
Type : Bullish
Timeframe : 1 hour
Bullish price crossover with Moving Average 50
Type : Bullish
Timeframe : 1 hour
An assessment of technical indicators does not currently provide any relevant information to suggest whether the signal given by the technical indicators is more bullish or bearish.
The Central Indicators scanner found no further results concerning independent technical indicators.
No signals are given by Central Patterns, a market scanner specialised in chart patterns, resistances and supports.
For a small rebound in the very short term, the Central Candlesticks scanner currently notes the presence of this bullish pattern in Japanese candlesticks:
Three white soldiers
Type : Bullish
Timeframe : 1 hour
| S3 | S2 | S1 | Price | R1 | R2 | R3 | |
|---|---|---|---|---|---|---|---|
| ProTrendLines | 6.80 | 6.98 | 7.14 | 7.18 | 7.24 | 9.99 | 16.51 |
| Change (%) | -5.29% | -2.79% | -0.56% | - | +0.84% | +39.14% | +129.94% |
| Change | -0.38 | -0.20 | -0.04 | - | +0.06 | +2.81 | +9.33 |
| Level | Major | Major | Major | - | Intermediate | Minor | Minor |
Pivot points can also be used to set your price objectives. Here is the price situation in relation to pivot points:
| Pivot points | S3 | S2 | S1 | PP | R1 | R2 | R3 |
|---|---|---|---|---|---|---|---|
| Standard | 7.08 | 7.12 | 7.16 | 7.20 | 7.24 | 7.28 | 7.32 |
| Camarilla | 7.17 | 7.18 | 7.18 | 7.19 | 7.20 | 7.21 | 7.21 |
| Woodie | 7.07 | 7.12 | 7.15 | 7.20 | 7.23 | 7.28 | 7.31 |
| Fibonacci | 7.12 | 7.15 | 7.17 | 7.20 | 7.23 | 7.25 | 7.28 |
| Pivot points | S3 | S2 | S1 | PP | R1 | R2 | R3 |
|---|---|---|---|---|---|---|---|
| Standard | 7.02 | 7.08 | 7.12 | 7.18 | 7.22 | 7.28 | 7.32 |
| Camarilla | 7.13 | 7.14 | 7.15 | 7.16 | 7.17 | 7.18 | 7.19 |
| Woodie | 7.01 | 7.08 | 7.11 | 7.18 | 7.21 | 7.28 | 7.31 |
| Fibonacci | 7.08 | 7.12 | 7.14 | 7.18 | 7.22 | 7.24 | 7.28 |
| Pivot points | S3 | S2 | S1 | PP | R1 | R2 | R3 |
|---|---|---|---|---|---|---|---|
| Standard | 5.71 | 6.00 | 6.43 | 6.72 | 7.15 | 7.44 | 7.87 |
| Camarilla | 6.67 | 6.74 | 6.80 | 6.87 | 6.94 | 7.00 | 7.07 |
| Woodie | 5.79 | 6.04 | 6.51 | 6.76 | 7.23 | 7.48 | 7.95 |
| Fibonacci | 6.00 | 6.27 | 6.44 | 6.72 | 6.99 | 7.16 | 7.44 |
Numerical data
The following is the status of the technical indicators and moving averages at the time of publication of this technical analysis:
| RSI (14): | 50.22 | |
| MACD (12,26,9): | 0.0000 | |
| Directional Movement: | 0.15 | |
| AROON (14): | -64.29 | |
| DEMA (21): | 7.18 | |
| Parabolic SAR (0,02-0,02-0,2): | 7.24 | |
| Elder Ray (13): | 0 | |
| Super Trend (3,10): | 7.12 | |
| Zig ZAG (10): | 7.18 | |
| VORTEX (21): | 0.8900 | |
| Stochastique (14,3,5): | 37.99 | |
| TEMA (21): | 7.17 | |
| Williams %R (14): | -54.29 | |
| Chande Momentum Oscillator (20): | -0.04 | |
| Repulse (5,40,3): | 0.2200 | |
| ROCnROLL: | 1 | |
| TRIX (15,9): | 0.0000 | |
| Courbe Coppock: | 0.17 |
| MA7: | 7.19 | |
| MA20: | 7.09 | |
| MA50: | 6.76 | |
| MA100: | 6.66 | |
| MAexp7: | 7.17 | |
| MAexp20: | 7.18 | |
| MAexp50: | 7.17 | |
| MAexp100: | 7.12 | |
| Price / MA7: | -0.14% | |
| Price / MA20: | +1.27% | |
| Price / MA50: | +6.21% | |
| Price / MA100: | +7.81% | |
| Price / MAexp7: | +0.14% | |
| Price / MAexp20: | -0% | |
| Price / MAexp50: | +0.14% | |
| Price / MAexp100: | +0.84% |
News
The latest news and videos published on NEUBERGER BERMAN ENERGY INFRA. AND INC. at the time of the analysis were as follows:
- Neuberger Berman MLP Income Fund Announces Portfolio Manager Update Call Thursday, November 29, 2018
- Neuberger Berman MLP Income Fund Announces Monthly Distributions
- Neuberger Berman MLP Income Fund Announces Monthly Distributions
- Neuberger Berman MLP Income Fund To Provide Fund Update Thursday, May 10, 2018
- Neuberger Berman MLP Income Fund Announces Monthly Distributions
About author
Online


Add a comment
Comments
0 comments on the analysis NEUBERGER BERMAN ENERGY INFRA. AND INC. - 1H