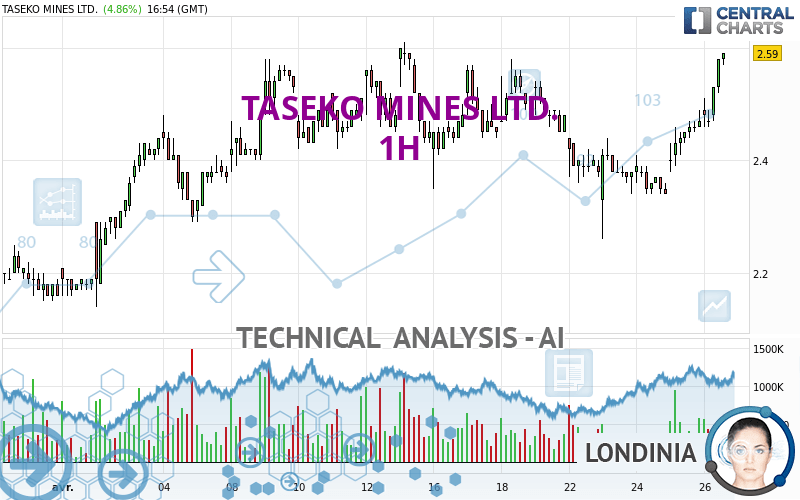
TASEKO MINES LTD. - 1H - Technical analysis published on 04/26/2024 (GMT)
- 78
- 0
Click here for a new analysis!
- Timeframe : 1H
- - Analysis generated on
- Status : INVALID

Summary of the analysis

Additional analysis
Quotes
The TASEKO MINES LTD. price is 2.56 USD. On the day, this instrument gained +3.64% and was traded between 2.46 USD and 2.56 USD over the period. The price is currently at +4.07% from its lowest and 0% from its highest.A bullish opening was detected by the Central Gaps scanner. Buyers are trying to impose a bullish momentum in the very short term.
Bullish opening
Type : Bullish
Timeframe : Openning
So that you have an overall view of the price change, here is a table showing the variations over several periods:
Near a new HIGH record (5 years)
Type : Bullish
Timeframe : Weekly
Near a new HIGH record (1 year)
Type : Bullish
Timeframe : Weekly
Near a new HIGH record (1st january)
Type : Bullish
Timeframe : Weekly
Near a new HIGH record (1 month)
Type : Bullish
Timeframe : Weekly
The Central Volumes scanner detects abnormal volumes on the asset:
Abnormal volumes
Timeframe : 20 days
Abnormal volumes
Timeframe : 50 days
Technical
Technical analysis of this 1H chart of TASEKO MINES LTD. indicates that the overall trend is strongly bullish. The signals given by the moving averages are 82.14% bullish. This strong bullish trend is confirmed by the strong signals currently being given by short-term moving averages. The Central Indicators scanner does not detect any result on moving averages that would impact this trend.
In fact, 17 technical indicators on 18 studied are currently bullish. But beware of excesses. The Central Indicators scanner currently detects this:
RSI indicator is overbought : over 70
Type : Neutral
Timeframe : 1 hour
CCI indicator is overbought : over 100
Type : Neutral
Timeframe : 1 hour
Williams %R indicator is overbought : over -20
Type : Neutral
Timeframe : 1 hour
Pivot points : price is over resistance 1
Type : Neutral
Timeframe : 1 hour
Price is back over the pivot point
Type : Bullish
Timeframe : Weekly
Central Patterns, the market scanner focusing on chart patterns, resistances and supports found these results:
Near horizontal resistance
Type : Bearish
Timeframe : 1 hour
Resistance of channel is broken
Type : Bullish
Timeframe : 1 hour
The Central Candlesticks scanner which studies Japanese candlesticks did not detect anything.
| S3 | S2 | S1 | Price | R1 | R2 | R3 | |
|---|---|---|---|---|---|---|---|
| ProTrendLines | 2.15 | 2.39 | 2.48 | 2.56 | 2.62 | 3.51 | 4.24 |
| Change (%) | -16.02% | -6.64% | -3.13% | - | +2.34% | +37.11% | +65.63% |
| Change | -0.41 | -0.17 | -0.08 | - | +0.06 | +0.95 | +1.68 |
| Level | Minor | Major | Minor | - | Major | Minor | Minor |
Attention could also be paid to pivot points to set price objectives:
| Pivot points | S3 | S2 | S1 | PP | R1 | R2 | R3 |
|---|---|---|---|---|---|---|---|
| Standard | 2.29 | 2.34 | 2.40 | 2.45 | 2.51 | 2.56 | 2.62 |
| Camarilla | 2.44 | 2.45 | 2.46 | 2.47 | 2.48 | 2.49 | 2.50 |
| Woodie | 2.31 | 2.34 | 2.42 | 2.45 | 2.53 | 2.56 | 2.64 |
| Fibonacci | 2.34 | 2.38 | 2.41 | 2.45 | 2.49 | 2.52 | 2.56 |
| Pivot points | S3 | S2 | S1 | PP | R1 | R2 | R3 |
|---|---|---|---|---|---|---|---|
| Standard | 2.08 | 2.21 | 2.34 | 2.47 | 2.60 | 2.73 | 2.86 |
| Camarilla | 2.39 | 2.41 | 2.44 | 2.46 | 2.48 | 2.51 | 2.53 |
| Woodie | 2.07 | 2.21 | 2.33 | 2.47 | 2.59 | 2.73 | 2.85 |
| Fibonacci | 2.21 | 2.31 | 2.37 | 2.47 | 2.57 | 2.63 | 2.73 |
| Pivot points | S3 | S2 | S1 | PP | R1 | R2 | R3 |
|---|---|---|---|---|---|---|---|
| Standard | 0.95 | 1.22 | 1.70 | 1.97 | 2.45 | 2.72 | 3.20 |
| Camarilla | 1.96 | 2.03 | 2.10 | 2.17 | 2.24 | 2.31 | 2.38 |
| Woodie | 1.05 | 1.27 | 1.80 | 2.02 | 2.55 | 2.77 | 3.30 |
| Fibonacci | 1.22 | 1.51 | 1.69 | 1.97 | 2.26 | 2.44 | 2.72 |
Numerical data
The following are the details of the technical indicators and moving averages that were collected to generate this technical analysis:
| RSI (14): | 68.89 | |
| MACD (12,26,9): | 0.0200 | |
| Directional Movement: | 16.16 | |
| AROON (14): | 92.86 | |
| DEMA (21): | 2.47 | |
| Parabolic SAR (0,02-0,02-0,2): | 2.41 | |
| Elder Ray (13): | 0.07 | |
| Super Trend (3,10): | 2.42 | |
| Zig ZAG (10): | 2.54 | |
| VORTEX (21): | 1.1400 | |
| Stochastique (14,3,5): | 92.79 | |
| TEMA (21): | 2.51 | |
| Williams %R (14): | -1.43 | |
| Chande Momentum Oscillator (20): | 0.20 | |
| Repulse (5,40,3): | 3.1700 | |
| ROCnROLL: | 1 | |
| TRIX (15,9): | 0.0400 | |
| Courbe Coppock: | 10.79 |
| MA7: | 2.44 | |
| MA20: | 2.43 | |
| MA50: | 2.02 | |
| MA100: | 1.70 | |
| MAexp7: | 2.49 | |
| MAexp20: | 2.45 | |
| MAexp50: | 2.44 | |
| MAexp100: | 2.41 | |
| Price / MA7: | +4.92% | |
| Price / MA20: | +5.35% | |
| Price / MA50: | +26.73% | |
| Price / MA100: | +50.59% | |
| Price / MAexp7: | +2.81% | |
| Price / MAexp20: | +4.49% | |
| Price / MAexp50: | +4.92% | |
| Price / MAexp100: | +6.22% |
News
The latest news and videos published on TASEKO MINES LTD. at the time of the analysis were as follows:
- Taseko Mines Limited - Taseko Mines Completes Notes Offering
- TASEKO MINES COMPLETES NOTES OFFERING
- Taseko Mines Limited - Taseko Announces Pricing of SR Secured Notes
- TASEKO ANNOUNCES PRICING OF SENIOR SECURED NOTES OFFERING
- Taseko Mines Limited - TASEKO ANNOUNCES OFFERING OF SENIOR SECURED NOTES
About author
Online


Add a comment
Comments
0 comments on the analysis TASEKO MINES LTD. - 1H