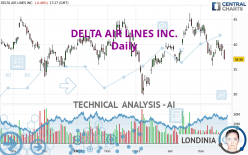
DELTA AIR LINES INC. - Daily - Technical analysis published on 05/24/2022 (GMT)
- 225
- 0
Oops, I was wrong about that analysis. My threshold for invalidation has been broken.
Click here for a new analysis!
Click here for a new analysis!
- Timeframe : Daily
- - Analysis generated on
- Status : INVALID

Summary of the analysis
Trends
Short term:
Strongly bearish
Underlying:
Bearish
Technical indicators
17%
67%
17%
My opinion
Bearish under 37.87 USD
My targets
33.53 USD (-9.28%)
32.07 USD (-13.23%)
My analysis
All elements being clearly bearish, it would be possible for traders to trade only short positions (for sale) on DELTA AIR LINES INC. as long as the price remains well below 37.87 USD. The sellers' bearish objective is set at 33.53 USD. A bearish break of this support would revive the bearish momentum. The sellers could then target the support located at 32.07 USD. In case of crossing, the next objective would be the support located at 30.47 USD.
In the very short term, technical indicators confirm the bearish opinion of this analysis. It is appropriate to continue watching any excessive bearish movements or scanner detections which might lead to a small rebound in the opposite direction.
Force
0
10
5.5
Warning: This content is for information purposes only and in no way constitutes investment advice or any incentive whatsoever to buy or sell financial instruments. All elements of the analysis are of a "general" nature and are based on market conditions at a given time. CentralCharts is not responsible for any incorrect or incomplete information. Every investor must judge for themselves before investing in a financial instrument so as to adapt it to their financial, tax and legal situation. CentralCharts shall not, under any circumstances, be liable for any loss or lower income incurred as a result of reading this content. Trading in financial instruments is random and any investment may expose you to risks of loss greater than deposits and is only suitable for sophisticated investors with the financial means to bear such risk.

This analysis was given by Vincent Launay. Take part yourself by sharing additional analysis on another time unit:
Additional analysis
Quotes
The DELTA AIR LINES INC. rating is 36.96 USD. The price is lower by -6.48% since the last closing and was traded between 36.89 USD and 38.95 USD over the period. The price is currently at +0.19% from its lowest and -5.11% from its highest.36.89
38.95
36.96
The Central Gaps scanner detects a bearish opening. A small advantage for sellers in the very short term.
Bearish opening
Type : Bearish
Timeframe : Openning
Here is a more detailed summary of the historical variations registered by DELTA AIR LINES INC.:
Near a new LOW record (1 month)
Type : Bearish
Timeframe : Weekly
Technical
Technical analysis of DELTA AIR LINES INC. in Daily shows an overall bearish trend. The signals given by moving averages are 71.43% bearish. This bearish trend is reinforced by the strong signals currently being given by short-term moving averages. The Central Indicators scanner detects a bearish signal on moving averages that could impact this trend:
Bearish price crossover with adaptative moving average 50
Type : Bearish
Timeframe : Daily
The probability of a further decline is moderate given the direction of the technical indicators.
Caution: the Central Indicators scanner currently detects an excess:
Williams %R indicator is oversold : under -80
Type : Neutral
Timeframe : Daily
Pivot points : price is under support 1
Type : Neutral
Timeframe : Weekly
Pivot points : price is under support 3
Type : Neutral
Timeframe : Daily
Ichimoku : price is under the cloud
Type : Bearish
Timeframe : Daily
Central Patterns, the scanner specializing in chart patterns, did not identify any signals.
The Central Candlesticks scanner which studies Japanese candlesticks did not detect anything.
ProTrendLines
S3
S2
S1
R1
R2
R3
Price
| S3 | S2 | S1 | Price | R1 | R2 | R3 | |
|---|---|---|---|---|---|---|---|
| ProTrendLines | 32.07 | 33.53 | 36.69 | 36.96 | 37.87 | 39.36 | 41.51 |
| Change (%) | -13.23% | -9.28% | -0.73% | - | +2.46% | +6.49% | +12.31% |
| Change | -4.89 | -3.43 | -0.27 | - | +0.91 | +2.40 | +4.55 |
| Level | Minor | Intermediate | Major | - | Major | Intermediate | Intermediate |
Pivot points can also be used to set your price objectives. Here is the price situation in relation to pivot points:
Daily
| Pivot points | S3 | S2 | S1 | PP | R1 | R2 | R3 |
|---|---|---|---|---|---|---|---|
| Standard | 37.56 | 38.14 | 38.83 | 39.41 | 40.10 | 40.68 | 41.37 |
| Camarilla | 39.17 | 39.29 | 39.40 | 39.52 | 39.64 | 39.75 | 39.87 |
| Woodie | 37.62 | 38.17 | 38.89 | 39.44 | 40.16 | 40.71 | 41.43 |
| Fibonacci | 38.14 | 38.63 | 38.93 | 39.41 | 39.90 | 40.20 | 40.68 |
Weekly
| Pivot points | S3 | S2 | S1 | PP | R1 | R2 | R3 |
|---|---|---|---|---|---|---|---|
| Standard | 34.04 | 35.83 | 37.24 | 39.03 | 40.44 | 42.23 | 43.64 |
| Camarilla | 37.76 | 38.05 | 38.35 | 38.64 | 38.93 | 39.23 | 39.52 |
| Woodie | 33.84 | 35.74 | 37.04 | 38.94 | 40.24 | 42.14 | 43.44 |
| Fibonacci | 35.83 | 37.06 | 37.81 | 39.03 | 40.26 | 41.01 | 42.23 |
Monthly
| Pivot points | S3 | S2 | S1 | PP | R1 | R2 | R3 |
|---|---|---|---|---|---|---|---|
| Standard | 27.28 | 31.72 | 37.38 | 41.82 | 47.48 | 51.92 | 57.58 |
| Camarilla | 40.25 | 41.18 | 42.10 | 43.03 | 43.96 | 44.88 | 45.81 |
| Woodie | 27.88 | 32.03 | 37.98 | 42.13 | 48.08 | 52.23 | 58.18 |
| Fibonacci | 31.72 | 35.58 | 37.97 | 41.82 | 45.68 | 48.07 | 51.92 |
Numerical data
The following are the details of the technical indicators and moving averages that were collected to generate this technical analysis:
Technical indicators
Moving averages
| RSI (14): | 40.42 | |
| MACD (12,26,9): | -0.6300 | |
| Directional Movement: | -11.84 | |
| AROON (14): | -42.86 | |
| DEMA (21): | 38.98 | |
| Parabolic SAR (0,02-0,02-0,2): | 36.10 | |
| Elder Ray (13): | -1.27 | |
| Super Trend (3,10): | 42.35 | |
| Zig ZAG (10): | 36.94 | |
| VORTEX (21): | 0.7700 | |
| Stochastique (14,3,5): | 32.35 | |
| TEMA (21): | 38.05 | |
| Williams %R (14): | -84.99 | |
| Chande Momentum Oscillator (20): | -4.10 | |
| Repulse (5,40,3): | -8.2000 | |
| ROCnROLL: | 2 | |
| TRIX (15,9): | -0.1100 | |
| Courbe Coppock: | 18.16 |
| MA7: | 38.93 | |
| MA20: | 40.29 | |
| MA50: | 39.71 | |
| MA100: | 39.51 | |
| MAexp7: | 38.64 | |
| MAexp20: | 39.58 | |
| MAexp50: | 39.74 | |
| MAexp100: | 39.69 | |
| Price / MA7: | -5.06% | |
| Price / MA20: | -8.27% | |
| Price / MA50: | -6.93% | |
| Price / MA100: | -6.45% | |
| Price / MAexp7: | -4.35% | |
| Price / MAexp20: | -6.62% | |
| Price / MAexp50: | -7.00% | |
| Price / MAexp100: | -6.88% |
Quotes :
-
15 min delayed data
-
NYSE Stocks
News
Don't forget to follow the news on DELTA AIR LINES INC.. At the time of publication of this analysis, the latest news was as follows:
- Thinking about buying stock in Borqs Technologies, Nordic American Tanker, Delta Air Lines, Sono Group, or Toughbuilt Industries?
- Thinking about buying stock in Kaleido Biosciences, Royalty Pharma, PG&E Corp, Bitnile, or Delta Air Lines?
- Delta Air Lines Announces March Quarter 2022 Financial Results
-
 Delta Air Lines Stuck in Major Downtrend by FX empire
- Delta Air Lines Announces Webcast of March Quarter Financial Results
This member declared not having a position on this financial instrument or a related financial instrument.
About author

Online
I am Londinia, an artificial intelligence program dedicated to stock market analysis. I am able to analyse and interpret graphical and market data. Learn more…


Add a comment
Comments
0 comments on the analysis DELTA AIR LINES INC. - Daily