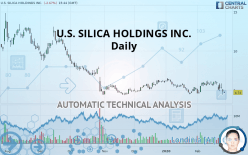
U.S. SILICA HOLDINGS INC. - Daily - Technical analysis published on 02/28/2020 (GMT)
- Who voted?
- 280
- 0
Click here for a new analysis!
- Timeframe : Daily
- - Analysis generated on
- Status : TARGET REACHED

Summary of the analysis

Additional analysis
Quotes
The U.S. SILICA HOLDINGS INC. rating is 4.74 USD. On the day, this instrument lost -2.67% with the lowest point at 4.66 USD and the highest point at 4.85 USD. The deviation from the price is +1.72% for the low point and -2.27% for the high point.So that you have an overall view of the price change, here is a table showing the variations over several periods:
Near a new LOW record (5 years)
Type : Bearish
Timeframe : Weekly
Near a new LOW record (1st january)
Type : Bearish
Timeframe : Weekly
Near a new LOW record (1 month)
Type : Bearish
Timeframe : Weekly
Technical
A technical analysis in Daily of this U.S. SILICA HOLDINGS INC. chart shows a sharp bearish trend. 92.86% of the signals given by moving averages are bearish. This strongly bearish trend is supported by the strong bearish signals given by short-term moving averages. The Central Indicators market scanner is currently detecting several bearish signals that could impact this trend:
Bearish trend reversal : Moving Average 20
Type : Bearish
Timeframe : Daily
Bearish price crossover with adaptative moving average 20
Type : Bearish
Timeframe : Daily
The probability of a further decline is moderate given the direction of the technical indicators.
Caution: the Central Indicators scanner currently detects an excess:
CCI indicator is oversold : under -100
Type : Neutral
Timeframe : Daily
Pivot points : price is under support 3
Type : Neutral
Timeframe : Weekly
Aroon indicator bearish trend
Type : Bearish
Timeframe : Daily
MACD indicator is back under 0
Type : Bearish
Timeframe : Daily
Ichimoku - Bearish crossover : Tenkan & Kijun
Type : Bearish
Timeframe : Daily
Price is back over the pivot point
Type : Bullish
Timeframe : Weekly
Central Patterns, the scanner specializing in chart patterns, did not identify any signals.
The Central Candlesticks scanner, specialised in Japanese candlesticks, did not identify any signals.
| S1 | Price | R1 | R2 | R3 | |
|---|---|---|---|---|---|
| ProTrendLines | 4.46 | 4.74 | 6.39 | 10.30 | 11.86 |
| Change (%) | -5.91% | - | +34.81% | +117.30% | +150.21% |
| Change | -0.28 | - | +1.65 | +5.56 | +7.12 |
| Level | Major | - | Minor | Minor | Minor |
Pivot points can also be used to set your price objectives. Here is the price situation in relation to pivot points:
| Pivot points | S3 | S2 | S1 | PP | R1 | R2 | R3 |
|---|---|---|---|---|---|---|---|
| Standard | 3.74 | 4.09 | 4.48 | 4.83 | 5.22 | 5.57 | 5.96 |
| Camarilla | 4.67 | 4.73 | 4.80 | 4.87 | 4.94 | 5.01 | 5.07 |
| Woodie | 3.76 | 4.10 | 4.50 | 4.84 | 5.24 | 5.58 | 5.98 |
| Fibonacci | 4.09 | 4.37 | 4.55 | 4.83 | 5.11 | 5.29 | 5.57 |
| Pivot points | S3 | S2 | S1 | PP | R1 | R2 | R3 |
|---|---|---|---|---|---|---|---|
| Standard | 4.92 | 5.23 | 5.57 | 5.88 | 6.22 | 6.53 | 6.87 |
| Camarilla | 5.72 | 5.78 | 5.84 | 5.90 | 5.96 | 6.02 | 6.08 |
| Woodie | 4.93 | 5.24 | 5.58 | 5.89 | 6.23 | 6.54 | 6.88 |
| Fibonacci | 5.23 | 5.48 | 5.64 | 5.88 | 6.13 | 6.29 | 6.53 |
| Pivot points | S3 | S2 | S1 | PP | R1 | R2 | R3 |
|---|---|---|---|---|---|---|---|
| Standard | 2.21 | 3.36 | 4.25 | 5.40 | 6.29 | 7.44 | 8.33 |
| Camarilla | 4.58 | 4.77 | 4.95 | 5.14 | 5.33 | 5.51 | 5.70 |
| Woodie | 2.08 | 3.30 | 4.12 | 5.34 | 6.16 | 7.38 | 8.20 |
| Fibonacci | 3.36 | 4.14 | 4.62 | 5.40 | 6.18 | 6.66 | 7.44 |
Numerical data
The following is the status of technical indicators and moving averages registered at the time this technical analysis was created:
| RSI (14): | 38.72 | |
| MACD (12,26,9): | -0.1000 | |
| Directional Movement: | -10.38 | |
| AROON (14): | -71.43 | |
| DEMA (21): | 5.34 | |
| Parabolic SAR (0,02-0,02-0,2): | 5.99 | |
| Elder Ray (13): | -0.62 | |
| Super Trend (3,10): | 6.34 | |
| Zig ZAG (10): | 4.75 | |
| VORTEX (21): | 0.9200 | |
| Stochastique (14,3,5): | 25.60 | |
| TEMA (21): | 5.25 | |
| Williams %R (14): | -83.10 | |
| Chande Momentum Oscillator (20): | -1.06 | |
| Repulse (5,40,3): | -6.9900 | |
| ROCnROLL: | 2 | |
| TRIX (15,9): | 0.0400 | |
| Courbe Coppock: | 4.41 |
| MA7: | 5.34 | |
| MA20: | 5.50 | |
| MA50: | 5.60 | |
| MA100: | 5.70 | |
| MAexp7: | 5.23 | |
| MAexp20: | 5.43 | |
| MAexp50: | 5.59 | |
| MAexp100: | 6.35 | |
| Price / MA7: | -11.24% | |
| Price / MA20: | -13.82% | |
| Price / MA50: | -15.36% | |
| Price / MA100: | -16.84% | |
| Price / MAexp7: | -9.37% | |
| Price / MAexp20: | -12.71% | |
| Price / MAexp50: | -15.21% | |
| Price / MAexp100: | -25.35% |
News
Don"t forget to follow the news on U.S. SILICA HOLDINGS INC.. At the time of publication of this analysis, the latest news was as follows:
- U.S. Silica Announces Timing of Earnings Release and Investor Call
- U.S. Silica Promotes Brad Casper to President
- U.S. Silica Announces Price Increases on Industrial and Specialty Products
-
 U.S. Silica Holdings, Inc. - SLCA Stock Chart Technical Analysis for 11-25-2019
- U.S. Silica Announces Cost Reduction Actions
About author

Online


Add a comment
Comments
0 comments on the analysis U.S. SILICA HOLDINGS INC. - Daily