TAIWAN SEMICONDUCTOR MANUFACTURING CO. - Taiwan Semiconductor Manufacturing Company (‘TSM’) - 09/26/2023 (GMT)
- 128
- 0
- Timeframe : Daily

TAIWAN SEMICONDUCTOR MANUFACTURING CO. Chart
Are you looking for opportunities in American stocks?
DISCOVER LONDINIA OPPORTUNITIES...
DISCOVER LONDINIA OPPORTUNITIES...
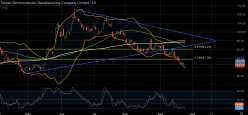
Shares of Taiwan Semiconductor Manufacturing Company Limited (symbol ‘TSM’) have incurred losses of around 17% through the last quarter. The company’s earnings report for the fiscal quarter ending September 2023 is expected to be released on Thursday 12th of October. The consensus EPS is $1.15, against $1.79 of the same quarter last year. ‘ Despite the recent decline in the share price, the company has an enviable financial image to display with a 15% decrease year over year of its long term debt, the total assets outweighing the total liabilities at a ratio of almost 3 : 1 and a current ratio at an outstanding 242%. The trailing annual dividend yield is at 13.43% while the payout ratio is just above 30%. This means that long term investors get a decent return on their shares ownership while the company is keeping the majority of its income (70%) to invest in expanding and growing. ‘ said Antreas Themistokleous, trading specialist at Exness. From the technical analysis perspective the price broke below the recent triangle formation in early September and is currently trading below all the technical indicators of moving averages and the bearish trendline. The combination of the oversold Stochastic oscillator as well as the lower band of the Bollinger bands acting as a support on the price might give way to some correction to the upside in the near short term. If this comes to be true then the first point of resistance might be seen around the $88 price area which is the inside resistance of price reaction in mid May and the second point of resistance around $92 price area which consists of the 61.8% of the weekly Fibonacci retracement level and the 50 day moving average.
This member declared not having a position on this financial instrument or a related financial instrument.
About author

Offline


Add a comment
Comments
0 comments on the analysis TAIWAN SEMICONDUCTOR MANUFACTURING CO. - Daily