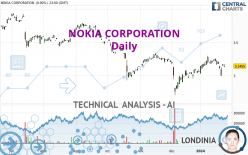
NOKIA CORPORATION - Daily - Technical analysis published on 01/25/2024 (GMT)
- 101
- 0
Click here for a new analysis!
- Timeframe : Daily
- - Analysis generated on
- Status : LEVEL MAINTAINED

Summary of the analysis

Additional analysis
Quotes
The NOKIA CORPORATION price is 3.3850 EUR. The price has increased by +7.61% since the last closing with the lowest point at 3.3325 EUR and the highest point at 3.4060 EUR. The deviation from the price is +1.58% for the low point and -0.62% for the high point.The Central Gaps scanner detects a bullish gap which is a sign that buyers have taken the lead in the very short term.
Opening Gap UP
Type : Bullish
Timeframe : Openning
Here is a more detailed summary of the historical variations registered by NOKIA CORPORATION:
New HIGH record (1st january)
Type : Bullish
Timeframe : Weekly
New HIGH record (1 month)
Type : Bullish
Timeframe : Weekly
The Central Volumes scanner detects abnormal volumes on the asset:
Abnormal volumes
Timeframe : 50 days
Technical
Technical analysis of NOKIA CORPORATION in Daily shows an overall bullish trend. 67.86% of the signals given by moving averages are bullish. This bullish trend is supported by the strong bullish signals given by short-term moving averages. The Central Indicators scanner detects bullish signals on moving averages that could impact this trend:
Bullish price crossover with Moving Average 20
Type : Bullish
Timeframe : Daily
Bullish price crossover with Moving Average 100
Type : Bullish
Timeframe : Daily
Bullish price crossover with adaptative moving average 50
Type : Bullish
Timeframe : Daily
Bullish price crossover with adaptative moving average 100
Type : Bullish
Timeframe : Daily
The probability of a further increase is high given the direction of the technical indicators.
Caution: the Central Indicators scanner currently detects an excess:
CCI indicator is overbought : over 100
Type : Neutral
Timeframe : Daily
Williams %R indicator is overbought : over -20
Type : Neutral
Timeframe : Daily
Pivot points : price is over resistance 2
Type : Neutral
Timeframe : Weekly
Pivot points : price is over resistance 3
Type : Neutral
Timeframe : Daily
MACD crosses UP its Moving Average
Type : Bullish
Timeframe : Daily
Parabolic SAR indicator bullish reversal
Type : Bullish
Timeframe : Daily
Aroon indicator bullish trend
Type : Bullish
Timeframe : Daily
Momentum indicator is back over 0
Type : Bullish
Timeframe : Daily
The Central Patterns scanner, which studies chart patterns, resistances and supports, has identified these signals:
Horizontal resistance is broken
Type : Bullish
Timeframe : Daily
Resistance of channel is broken
Type : Bullish
Timeframe : Daily
For a small rebound in the very short term, the Central Candlesticks scanner currently notes the presence of this bullish pattern in Japanese candlesticks:
Upside gap
Type : Bullish
Timeframe : Daily
| S3 | S2 | S1 | Price | R1 | R2 | R3 | |
|---|---|---|---|---|---|---|---|
| ProTrendLines | 2.7226 | 3.0489 | 3.2388 | 3.3850 | 3.3865 | 3.6369 | 3.8783 |
| Change (%) | -19.57% | -9.93% | -4.32% | - | +0.04% | +7.44% | +14.57% |
| Change | -0.6624 | -0.3361 | -0.1462 | - | +0.0015 | +0.2519 | +0.4933 |
| Level | Major | Intermediate | Minor | - | Intermediate | Intermediate | Minor |
To determine price objectives, it is also possible to use the pivot points. Here is the price position in relation to pivot points:
| Pivot points | S3 | S2 | S1 | PP | R1 | R2 | R3 |
|---|---|---|---|---|---|---|---|
| Standard | 3.0965 | 3.1165 | 3.1310 | 3.1510 | 3.1655 | 3.1855 | 3.2000 |
| Camarilla | 3.1360 | 3.1392 | 3.1423 | 3.1455 | 3.1487 | 3.1518 | 3.1550 |
| Woodie | 3.0938 | 3.1151 | 3.1283 | 3.1496 | 3.1628 | 3.1841 | 3.1973 |
| Fibonacci | 3.1165 | 3.1297 | 3.1378 | 3.1510 | 3.1642 | 3.1723 | 3.1855 |
| Pivot points | S3 | S2 | S1 | PP | R1 | R2 | R3 |
|---|---|---|---|---|---|---|---|
| Standard | 2.8910 | 2.9955 | 3.0525 | 3.1570 | 3.2140 | 3.3185 | 3.3755 |
| Camarilla | 3.0651 | 3.0799 | 3.0947 | 3.1095 | 3.1243 | 3.1391 | 3.1539 |
| Woodie | 2.8673 | 2.9836 | 3.0288 | 3.1451 | 3.1903 | 3.3066 | 3.3518 |
| Fibonacci | 2.9955 | 3.0572 | 3.0953 | 3.1570 | 3.2187 | 3.2568 | 3.3185 |
| Pivot points | S3 | S2 | S1 | PP | R1 | R2 | R3 |
|---|---|---|---|---|---|---|---|
| Standard | 2.2553 | 2.4792 | 2.7693 | 2.9932 | 3.2833 | 3.5072 | 3.7973 |
| Camarilla | 2.9182 | 2.9653 | 3.0124 | 3.0595 | 3.1066 | 3.1537 | 3.2009 |
| Woodie | 2.2885 | 2.4958 | 2.8025 | 3.0098 | 3.3165 | 3.5238 | 3.8305 |
| Fibonacci | 2.4792 | 2.6755 | 2.7968 | 2.9932 | 3.1895 | 3.3108 | 3.5072 |
Numerical data
The following is the status of the technical indicators and moving averages at the time of publication of this technical analysis:
| RSI (14): | 65.36 | |
| MACD (12,26,9): | 0.0296 | |
| Directional Movement: | 16.9871 | |
| AROON (14): | 21.4286 | |
| DEMA (21): | 3.2050 | |
| Parabolic SAR (0,02-0,02-0,2): | 3.0000 | |
| Elder Ray (13): | 0.1801 | |
| Super Trend (3,10): | 3.1079 | |
| Zig ZAG (10): | 3.3735 | |
| VORTEX (21): | 0.9902 | |
| Stochastique (14,3,5): | 65.95 | |
| TEMA (21): | 3.2365 | |
| Williams %R (14): | -5.17 | |
| Chande Momentum Oscillator (20): | 0.1715 | |
| Repulse (5,40,3): | 1.6918 | |
| ROCnROLL: | 1 | |
| TRIX (15,9): | 0.1126 | |
| Courbe Coppock: | 3.61 |
| MA7: | 3.1823 | |
| MA20: | 3.1731 | |
| MA50: | 3.1376 | |
| MA100: | 3.2680 | |
| MAexp7: | 3.2110 | |
| MAexp20: | 3.1717 | |
| MAexp50: | 3.1696 | |
| MAexp100: | 3.2673 | |
| Price / MA7: | +6.37% | |
| Price / MA20: | +6.68% | |
| Price / MA50: | +7.89% | |
| Price / MA100: | +3.58% | |
| Price / MAexp7: | +5.42% | |
| Price / MAexp20: | +6.73% | |
| Price / MAexp50: | +6.80% | |
| Price / MAexp100: | +3.60% |
About author
Online


Add a comment
Comments
0 comments on the analysis NOKIA CORPORATION - Daily