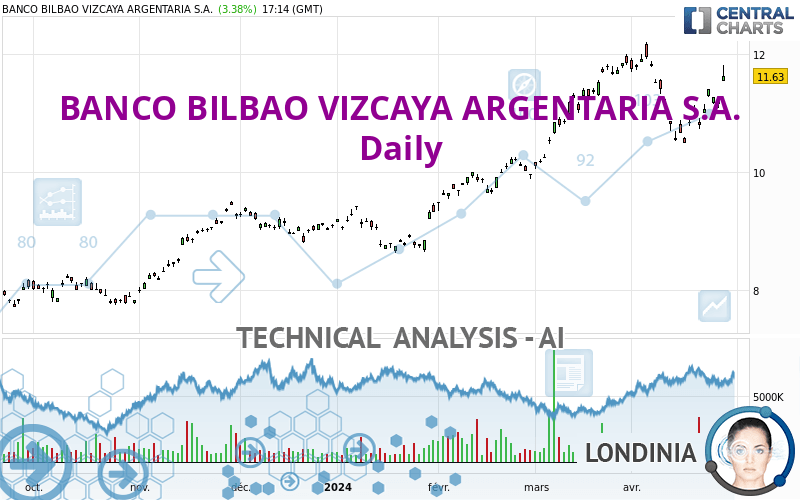
BANCO BILBAO VIZCAYA ARGENTARIA S.A. - Daily - Technical analysis published on 04/26/2024 (GMT)
- 92
- 0
Click here for a new analysis!
- Timeframe : Daily
- - Analysis generated on
- Status : INVALID
Summary of the analysis

Additional analysis
Quotes
The BANCO BILBAO VIZCAYA ARGENTARIA S.A. price is 11.63 USD. On the day, this instrument gained +3.38% and was traded between 11.54 USD and 11.81 USD over the period. The price is currently at +0.78% from its lowest and -1.52% from its highest.The Central Gaps scanner detects a bullish gap which is a sign that buyers have taken the lead in the very short term.
Opening Gap UP
Type : Bullish
Timeframe : Openning
So that you have an overall view of the price change, here is a table showing the variations over several periods:
New HIGH record (5 years)
Type : Bullish
Timeframe : Weekly
New HIGH record (1 year)
Type : Bullish
Timeframe : Weekly
New HIGH record (1st january)
Type : Bullish
Timeframe : Weekly
New HIGH record (1 month)
Type : Bullish
Timeframe : Weekly
Technical
Technical analysis of BANCO BILBAO VIZCAYA ARGENTARIA S.A. in Daily shows a strongly overall bullish trend. The signals given by the moving averages are 92.86% bullish. This strong bullish trend is confirmed by the strong signals currently being given by short-term moving averages. The Central Indicators market scanner is currently detecting a bullish signal that could impact this trend:
Bullish price crossover with adaptative moving average 20
Type : Bullish
Timeframe : Daily
In fact, 14 technical indicators on 18 studied are currently positioned bullish. But beware of excesses. The Central Indicators scanner currently detects this:
CCI indicator is overbought : over 100
Type : Neutral
Timeframe : Daily
Williams %R indicator is overbought : over -20
Type : Neutral
Timeframe : Daily
Pivot points : price is over resistance 2
Type : Neutral
Timeframe : Weekly
Pivot points : price is over resistance 3
Type : Neutral
Timeframe : Daily
MACD crosses UP its Moving Average
Type : Bullish
Timeframe : Daily
Aroon indicator bullish trend
Type : Bullish
Timeframe : Daily
Momentum indicator is back over 0
Type : Bullish
Timeframe : Daily
An analysis of the price chart with the Central Patterns scanner (detector of chart patterns and resistances and supports) shows a result that can have an impact on the price change:
Horizontal resistance is broken
Type : Bullish
Timeframe : Daily
The presence of a bullish Japanese candlestick pattern detected by Central Candlesticks that could cause a very short term rebound was also detected:
Upside gap
Type : Bullish
Timeframe : Daily
| S3 | S2 | S1 | Price | |
|---|---|---|---|---|
| ProTrendLines | 9.10 | 10.50 | 11.53 | 11.63 |
| Change (%) | -21.75% | -9.72% | -0.86% | - |
| Change | -2.53 | -1.13 | -0.10 | - |
| Level | Intermediate | Intermediate | Major | - |
Attention could also be paid to pivot points to set price objectives:
| Pivot points | S3 | S2 | S1 | PP | R1 | R2 | R3 |
|---|---|---|---|---|---|---|---|
| Standard | 10.94 | 11.02 | 11.13 | 11.21 | 11.32 | 11.40 | 11.51 |
| Camarilla | 11.20 | 11.22 | 11.23 | 11.25 | 11.27 | 11.29 | 11.30 |
| Woodie | 10.97 | 11.03 | 11.16 | 11.22 | 11.35 | 11.41 | 11.54 |
| Fibonacci | 11.02 | 11.09 | 11.13 | 11.21 | 11.28 | 11.32 | 11.40 |
| Pivot points | S3 | S2 | S1 | PP | R1 | R2 | R3 |
|---|---|---|---|---|---|---|---|
| Standard | 9.82 | 10.16 | 10.47 | 10.81 | 11.12 | 11.46 | 11.77 |
| Camarilla | 10.61 | 10.67 | 10.73 | 10.79 | 10.85 | 10.91 | 10.97 |
| Woodie | 9.82 | 10.15 | 10.47 | 10.80 | 11.12 | 11.45 | 11.77 |
| Fibonacci | 10.16 | 10.41 | 10.56 | 10.81 | 11.06 | 11.21 | 11.46 |
| Pivot points | S3 | S2 | S1 | PP | R1 | R2 | R3 |
|---|---|---|---|---|---|---|---|
| Standard | 8.34 | 9.02 | 10.21 | 10.89 | 12.08 | 12.76 | 13.95 |
| Camarilla | 10.90 | 11.07 | 11.24 | 11.41 | 11.58 | 11.75 | 11.92 |
| Woodie | 8.61 | 9.15 | 10.48 | 11.02 | 12.35 | 12.89 | 14.22 |
| Fibonacci | 9.02 | 9.73 | 10.17 | 10.89 | 11.60 | 12.04 | 12.76 |
Numerical data
The following is the status of the technical indicators and moving averages at the time of publication of this technical analysis:
| RSI (14): | 63.44 | |
| MACD (12,26,9): | 0.1500 | |
| Directional Movement: | 21.79 | |
| AROON (14): | 57.14 | |
| DEMA (21): | 11.30 | |
| Parabolic SAR (0,02-0,02-0,2): | 10.61 | |
| Elder Ray (13): | 0.52 | |
| Super Trend (3,10): | 10.79 | |
| Zig ZAG (10): | 11.64 | |
| VORTEX (21): | 0.7800 | |
| Stochastique (14,3,5): | 76.07 | |
| TEMA (21): | 11.20 | |
| Williams %R (14): | -13.26 | |
| Chande Momentum Oscillator (20): | 0.50 | |
| Repulse (5,40,3): | 1.7100 | |
| ROCnROLL: | 1 | |
| TRIX (15,9): | 0.1500 | |
| Courbe Coppock: | 2.64 |
| MA7: | 11.20 | |
| MA20: | 11.14 | |
| MA50: | 10.69 | |
| MA100: | 9.77 | |
| MAexp7: | 11.25 | |
| MAexp20: | 11.10 | |
| MAexp50: | 10.66 | |
| MAexp100: | 9.97 | |
| Price / MA7: | +3.84% | |
| Price / MA20: | +4.40% | |
| Price / MA50: | +8.79% | |
| Price / MA100: | +19.04% | |
| Price / MAexp7: | +3.38% | |
| Price / MAexp20: | +4.77% | |
| Price / MAexp50: | +9.10% | |
| Price / MAexp100: | +16.65% |
About author
Online


Add a comment
Comments
0 comments on the analysis BANCO BILBAO VIZCAYA ARGENTARIA S.A. - Daily