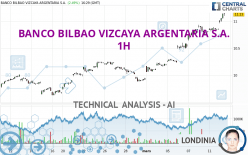
BANCO BILBAO VIZCAYA ARGENTARIA S.A. - 1H - Technical analysis published on 03/12/2024 (GMT)
- 94
- 0
Click here for a new analysis!
- Timeframe : 1H
- - Analysis generated on
- Status : LEVEL MAINTAINED

Summary of the analysis

Additional analysis
Quotes
BANCO BILBAO VIZCAYA ARGENTARIA S.A. rating 11.14 USD. On the day, this instrument gained +2.58% and was traded between 10.96 USD and 11.15 USD over the period. The price is currently at +1.64% from its lowest and -0.09% from its highest.A bullish gap was detected at the opening by the Central Gaps scanner. There are a lot of buyers and they have the upper hand in the very short term.
Opening Gap UP
Type : Bullish
Timeframe : Openning
Here is a more detailed summary of the historical variations registered by BANCO BILBAO VIZCAYA ARGENTARIA S.A.:
New HIGH record (5 years)
Type : Bullish
Timeframe : Weekly
New HIGH record (1 year)
Type : Bullish
Timeframe : Weekly
New HIGH record (1st january)
Type : Bullish
Timeframe : Weekly
New HIGH record (1 month)
Type : Bullish
Timeframe : Weekly
The Central Volumes scanner detects abnormal volumes on the asset:
Abnormal volumes
Timeframe : 5 days
Technical
A technical analysis in 1H of this BANCO BILBAO VIZCAYA ARGENTARIA S.A. chart shows a strongly bullish trend. 92.86% of the signals given by moving averages are bullish. The overall trend is supported by the strong bullish signals from short-term moving averages. An assessment of moving averages reveals a bearish signal that could impact this trend:
Moving Average bearish crossovers : AMA20 & AMA50
Type : Bearish
Timeframe : 1 hour
In fact, 15 technical indicators on 18 studied are currently positioned bullish. Caution: the Central Indicators scanner currently detects an excess:
RSI indicator is overbought : over 80
Type : Neutral
Timeframe : 1 hour
CCI indicator is overbought : over 100
Type : Neutral
Timeframe : 1 hour
Previous candle closed over Bollinger bands
Type : Neutral
Timeframe : 1 hour
Williams %R indicator is overbought : over -20
Type : Neutral
Timeframe : 1 hour
Pivot points : price is over resistance 1
Type : Neutral
Timeframe : Weekly
Pivot points : price is over resistance 3
Type : Neutral
Timeframe : 1 hour
An analysis of the price chart with the Central Patterns scanner (detector of chart patterns and resistances and supports) shows a result that can have an impact on the price change:
Near resistance of channel
Type : Bearish
Timeframe : 1 hour
The Central Candlesticks scanner which studies Japanese candlesticks did not detect anything.
| S3 | S2 | S1 | Price | |
|---|---|---|---|---|
| ProTrendLines | 10.23 | 10.76 | 10.93 | 11.14 |
| Change (%) | -8.17% | -3.41% | -1.89% | - |
| Change | -0.91 | -0.38 | -0.21 | - |
| Level | Intermediate | Minor | Intermediate | - |
To determine price objectives, it is also possible to use the pivot points. Here is the price position in relation to pivot points:
| Pivot points | S3 | S2 | S1 | PP | R1 | R2 | R3 |
|---|---|---|---|---|---|---|---|
| Standard | 10.74 | 10.77 | 10.82 | 10.85 | 10.90 | 10.93 | 10.98 |
| Camarilla | 10.84 | 10.85 | 10.85 | 10.86 | 10.87 | 10.88 | 10.88 |
| Woodie | 10.74 | 10.78 | 10.82 | 10.86 | 10.90 | 10.94 | 10.98 |
| Fibonacci | 10.77 | 10.80 | 10.82 | 10.85 | 10.88 | 10.90 | 10.93 |
| Pivot points | S3 | S2 | S1 | PP | R1 | R2 | R3 |
|---|---|---|---|---|---|---|---|
| Standard | 9.56 | 9.86 | 10.33 | 10.63 | 11.10 | 11.40 | 11.87 |
| Camarilla | 10.59 | 10.66 | 10.73 | 10.80 | 10.87 | 10.94 | 11.01 |
| Woodie | 9.65 | 9.90 | 10.42 | 10.67 | 11.19 | 11.44 | 11.96 |
| Fibonacci | 9.86 | 10.15 | 10.34 | 10.63 | 10.92 | 11.11 | 11.40 |
| Pivot points | S3 | S2 | S1 | PP | R1 | R2 | R3 |
|---|---|---|---|---|---|---|---|
| Standard | 8.55 | 8.95 | 9.45 | 9.85 | 10.35 | 10.75 | 11.25 |
| Camarilla | 9.70 | 9.79 | 9.87 | 9.95 | 10.03 | 10.12 | 10.20 |
| Woodie | 8.60 | 8.98 | 9.50 | 9.88 | 10.40 | 10.78 | 11.30 |
| Fibonacci | 8.95 | 9.29 | 9.51 | 9.85 | 10.19 | 10.41 | 10.75 |
Numerical data
The following is the status of the technical indicators and moving averages at the time of publication of this technical analysis:
| RSI (14): | 82.01 | |
| MACD (12,26,9): | 0.1300 | |
| Directional Movement: | 42.25 | |
| AROON (14): | 92.86 | |
| DEMA (21): | 11.05 | |
| Parabolic SAR (0,02-0,02-0,2): | 10.80 | |
| Elder Ray (13): | 0.19 | |
| Super Trend (3,10): | 10.96 | |
| Zig ZAG (10): | 11.12 | |
| VORTEX (21): | 1.1700 | |
| Stochastique (14,3,5): | 96.61 | |
| TEMA (21): | 11.07 | |
| Williams %R (14): | -7.69 | |
| Chande Momentum Oscillator (20): | 0.32 | |
| Repulse (5,40,3): | 1.0800 | |
| ROCnROLL: | 1 | |
| TRIX (15,9): | 0.1600 | |
| Courbe Coppock: | 3.14 |
| MA7: | 10.66 | |
| MA20: | 10.22 | |
| MA50: | 9.62 | |
| MA100: | 9.16 | |
| MAexp7: | 11.02 | |
| MAexp20: | 10.88 | |
| MAexp50: | 10.65 | |
| MAexp100: | 10.39 | |
| Price / MA7: | +4.50% | |
| Price / MA20: | +9.00% | |
| Price / MA50: | +15.80% | |
| Price / MA100: | +21.62% | |
| Price / MAexp7: | +1.09% | |
| Price / MAexp20: | +2.39% | |
| Price / MAexp50: | +4.60% | |
| Price / MAexp100: | +7.22% |
About author
Online


Add a comment
Comments
0 comments on the analysis BANCO BILBAO VIZCAYA ARGENTARIA S.A. - 1H