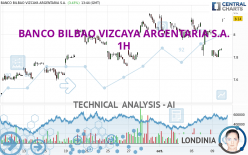
BANCO BILBAO VIZCAYA ARGENTARIA S.A. - 1H - Technical analysis published on 10/10/2023 (GMT)
- 119
- 0
Click here for a new analysis!
- Timeframe : 1H
- - Analysis generated on
- Status : TARGET REACHED

Summary of the analysis

Additional analysis
Quotes
The BANCO BILBAO VIZCAYA ARGENTARIA S.A. price is 8.12 USD. The price has increased by +3.18% since the last closing and was between 8.11 USD and 8.13 USD. This implies that the price is at +0.12% from its lowest and at -0.12% from its highest.The Central Gaps scanner detects a bullish gap which is a sign that buyers have taken the lead in the very short term.
Opening Gap UP
Type : Bullish
Timeframe : Openning
So that you have an overall view of the price change, here is a table showing the variations over several periods:
Near a new HIGH record (5 years)
Type : Bullish
Timeframe : Weekly
Near a new HIGH record (1 year)
Type : Bullish
Timeframe : Weekly
Near a new HIGH record (1st january)
Type : Bullish
Timeframe : Weekly
Near a new LOW record (1 month)
Type : Bearish
Timeframe : Weekly
Technical
A technical analysis in 1H of this BANCO BILBAO VIZCAYA ARGENTARIA S.A. chart shows a strongly bullish trend. 82.14% of the signals given by moving averages are bullish. The overall trend is supported by the strong bullish signals from short-term moving averages. The Central Indicators market scanner is currently detecting several bullish signals that could impact this trend:
Bullish price crossover with Moving Average 20
Type : Bullish
Timeframe : 1 hour
Bullish price crossover with Moving Average 50
Type : Bullish
Timeframe : 1 hour
Bullish price crossover with Moving Average 100
Type : Bullish
Timeframe : 1 hour
Bullish price crossover with adaptative moving average 20
Type : Bullish
Timeframe : 1 hour
Bullish price crossover with adaptative moving average 50
Type : Bullish
Timeframe : 1 hour
Bullish price crossover with adaptative moving average 100
Type : Bullish
Timeframe : 1 hour
In fact, 10 technical indicators on 18 studied are currently bullish. Caution: the Central Indicators scanner currently detects an excess:
CCI indicator is overbought : over 100
Type : Neutral
Timeframe : 1 hour
Williams %R indicator is overbought : over -20
Type : Neutral
Timeframe : 1 hour
Pivot points : price is over resistance 3
Type : Neutral
Timeframe : 1 hour
RSI indicator is back over 50
Type : Bullish
Timeframe : 1 hour
MACD crosses UP its Moving Average
Type : Bullish
Timeframe : 1 hour
Parabolic SAR indicator bullish reversal
Type : Bullish
Timeframe : 1 hour
Aroon indicator bullish trend
Type : Bullish
Timeframe : 1 hour
Ichimoku : price is over the cloud
Type : Bullish
Timeframe : 1 hour
SuperTrend indicator bullish reversal
Type : Bullish
Timeframe : 1 hour
Momentum indicator is back over 0
Type : Bullish
Timeframe : 1 hour
The analysis of the price chart with Central Patterns scanners does not return any result.
The Central Candlesticks scanner, specialised in Japanese candlesticks, did not identify any signals.
| S3 | S2 | S1 | Price | R1 | R2 | |
|---|---|---|---|---|---|---|
| ProTrendLines | 7.88 | 7.96 | 8.08 | 8.12 | 8.19 | 8.64 |
| Change (%) | -2.96% | -1.97% | -0.49% | - | +0.86% | +6.40% |
| Change | -0.24 | -0.16 | -0.04 | - | +0.07 | +0.52 |
| Level | Minor | Intermediate | Major | - | Intermediate | Intermediate |
Pivot points can also be used to set your price objectives. Here is the price situation in relation to pivot points:
| Pivot points | S3 | S2 | S1 | PP | R1 | R2 | R3 |
|---|---|---|---|---|---|---|---|
| Standard | 7.74 | 7.77 | 7.82 | 7.85 | 7.90 | 7.93 | 7.98 |
| Camarilla | 7.85 | 7.86 | 7.86 | 7.87 | 7.88 | 7.89 | 7.89 |
| Woodie | 7.75 | 7.78 | 7.83 | 7.86 | 7.91 | 7.94 | 7.99 |
| Fibonacci | 7.77 | 7.80 | 7.82 | 7.85 | 7.88 | 7.90 | 7.93 |
| Pivot points | S3 | S2 | S1 | PP | R1 | R2 | R3 |
|---|---|---|---|---|---|---|---|
| Standard | 7.44 | 7.63 | 7.81 | 8.00 | 8.18 | 8.37 | 8.55 |
| Camarilla | 7.90 | 7.93 | 7.97 | 8.00 | 8.03 | 8.07 | 8.10 |
| Woodie | 7.45 | 7.63 | 7.82 | 8.00 | 8.19 | 8.37 | 8.56 |
| Fibonacci | 7.63 | 7.77 | 7.86 | 8.00 | 8.14 | 8.23 | 8.37 |
| Pivot points | S3 | S2 | S1 | PP | R1 | R2 | R3 |
|---|---|---|---|---|---|---|---|
| Standard | 6.80 | 7.10 | 7.58 | 7.88 | 8.36 | 8.66 | 9.14 |
| Camarilla | 7.84 | 7.91 | 7.98 | 8.05 | 8.12 | 8.19 | 8.27 |
| Woodie | 6.88 | 7.15 | 7.66 | 7.93 | 8.44 | 8.71 | 9.22 |
| Fibonacci | 7.10 | 7.40 | 7.59 | 7.88 | 8.18 | 8.37 | 8.66 |
Numerical data
The following are the details of the technical indicators and moving averages that were collected to generate this technical analysis:
| RSI (14): | 61.75 | |
| MACD (12,26,9): | -0.0300 | |
| Directional Movement: | 15.07 | |
| AROON (14): | 28.57 | |
| DEMA (21): | 7.91 | |
| Parabolic SAR (0,02-0,02-0,2): | 7.80 | |
| Elder Ray (13): | 0.18 | |
| Super Trend (3,10): | 7.89 | |
| Zig ZAG (10): | 8.12 | |
| VORTEX (21): | 1.0300 | |
| Stochastique (14,3,5): | 49.03 | |
| TEMA (21): | 7.89 | |
| Williams %R (14): | -3.03 | |
| Chande Momentum Oscillator (20): | 0.09 | |
| Repulse (5,40,3): | 0.1300 | |
| ROCnROLL: | 1 | |
| TRIX (15,9): | -0.0600 | |
| Courbe Coppock: | 2.82 |
| MA7: | 8.03 | |
| MA20: | 7.90 | |
| MA50: | 7.79 | |
| MA100: | 7.60 | |
| MAexp7: | 7.93 | |
| MAexp20: | 7.95 | |
| MAexp50: | 7.97 | |
| MAexp100: | 7.94 | |
| Price / MA7: | +1.12% | |
| Price / MA20: | +2.78% | |
| Price / MA50: | +4.24% | |
| Price / MA100: | +6.84% | |
| Price / MAexp7: | +2.40% | |
| Price / MAexp20: | +2.14% | |
| Price / MAexp50: | +1.88% | |
| Price / MAexp100: | +2.27% |
About author
Online


Add a comment
Comments
0 comments on the analysis BANCO BILBAO VIZCAYA ARGENTARIA S.A. - 1H