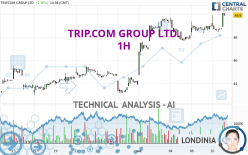
TRIP.COM GROUP LTD. - 1H - Technical analysis published on 04/11/2024 (GMT)
- 78
- 0
Click here for a new analysis!
- Timeframe : 1H
- - Analysis generated on
- Status : INVALID

Summary of the analysis

Additional analysis
Quotes
The TRIP.COM GROUP LTD. price is 49.94 USD. The price registered an increase of +2.44% on the session and was traded between 48.90 USD and 50.09 USD over the period. The price is currently at +2.13% from its lowest and -0.30% from its highest.Here is a more detailed summary of the historical variations registered by TRIP.COM GROUP LTD.:
New HIGH record (5 years)
Type : Bullish
Timeframe : Weekly
New HIGH record (1 year)
Type : Bullish
Timeframe : Weekly
New HIGH record (1st january)
Type : Bullish
Timeframe : Weekly
New HIGH record (1 month)
Type : Bullish
Timeframe : Weekly
Technical
Technical analysis of TRIP.COM GROUP LTD. in 1H shows a strongly overall bullish trend. The signals given by the moving averages are 92.86% bullish. This strong bullish trend is confirmed by the strong signals currently being given by short-term moving averages. The Central Indicators scanner does not detect any result on moving averages that would impact this trend.
The probability of a further increase is high given the direction of the technical indicators.
But beware of excesses. The Central Indicators scanner currently detects this:
CCI indicator is overbought : over 100
Type : Neutral
Timeframe : 1 hour
Previous candle closed over Bollinger bands
Type : Neutral
Timeframe : 1 hour
Williams %R indicator is overbought : over -20
Type : Neutral
Timeframe : 1 hour
Pivot points : price is over resistance 1
Type : Neutral
Timeframe : 1 hour
The Central Patterns scanner, which studies chart patterns, resistances and supports, has identified these signals:
Near horizontal resistance
Type : Bearish
Timeframe : 1 hour
Resistance of channel is broken
Type : Bullish
Timeframe : 1 hour
Central Candlesticks, the scanner specialised in Japanese candlesticks, detects these bearish signals that could support the hypothesis of a small drop in the very short term:
Bearish harami
Type : Bearish
Timeframe : 1 hour
Bearish harami cross
Type : Bearish
Timeframe : 1 hour
| S3 | S2 | S1 | Price | R1 | R2 | |
|---|---|---|---|---|---|---|
| ProTrendLines | 47.34 | 48.36 | 49.38 | 49.94 | 51.72 | 59.73 |
| Change (%) | -5.21% | -3.16% | -1.12% | - | +3.56% | +19.60% |
| Change | -2.60 | -1.58 | -0.56 | - | +1.78 | +9.79 |
| Level | Intermediate | Minor | Major | - | Minor | Major |
Attention could also be paid to pivot points to set price objectives:
| Pivot points | S3 | S2 | S1 | PP | R1 | R2 | R3 |
|---|---|---|---|---|---|---|---|
| Standard | 46.64 | 47.53 | 48.14 | 49.03 | 49.64 | 50.53 | 51.14 |
| Camarilla | 48.34 | 48.48 | 48.61 | 48.75 | 48.89 | 49.03 | 49.16 |
| Woodie | 46.50 | 47.46 | 48.00 | 48.96 | 49.50 | 50.46 | 51.00 |
| Fibonacci | 47.53 | 48.10 | 48.46 | 49.03 | 49.60 | 49.96 | 50.53 |
| Pivot points | S3 | S2 | S1 | PP | R1 | R2 | R3 |
|---|---|---|---|---|---|---|---|
| Standard | 40.32 | 42.51 | 45.33 | 47.52 | 50.34 | 52.53 | 55.35 |
| Camarilla | 46.76 | 47.22 | 47.68 | 48.14 | 48.60 | 49.06 | 49.52 |
| Woodie | 40.63 | 42.67 | 45.64 | 47.68 | 50.65 | 52.69 | 55.66 |
| Fibonacci | 42.51 | 44.43 | 45.61 | 47.52 | 49.44 | 50.62 | 52.53 |
| Pivot points | S3 | S2 | S1 | PP | R1 | R2 | R3 |
|---|---|---|---|---|---|---|---|
| Standard | 38.36 | 40.20 | 42.05 | 43.89 | 45.74 | 47.58 | 49.43 |
| Camarilla | 42.88 | 43.21 | 43.55 | 43.89 | 44.23 | 44.57 | 44.91 |
| Woodie | 38.36 | 40.20 | 42.05 | 43.89 | 45.74 | 47.58 | 49.43 |
| Fibonacci | 40.20 | 41.61 | 42.48 | 43.89 | 45.30 | 46.17 | 47.58 |
Numerical data
The following are the details of the technical indicators and moving averages that were collected to generate this technical analysis:
| RSI (14): | 69.94 | |
| MACD (12,26,9): | 0.2700 | |
| Directional Movement: | 29.96 | |
| AROON (14): | 92.86 | |
| DEMA (21): | 49.27 | |
| Parabolic SAR (0,02-0,02-0,2): | 48.58 | |
| Elder Ray (13): | 0.87 | |
| Super Trend (3,10): | 48.76 | |
| Zig ZAG (10): | 50.00 | |
| VORTEX (21): | 1.1400 | |
| Stochastique (14,3,5): | 72.01 | |
| TEMA (21): | 49.27 | |
| Williams %R (14): | -10.18 | |
| Chande Momentum Oscillator (20): | 0.94 | |
| Repulse (5,40,3): | 1.8000 | |
| ROCnROLL: | 1 | |
| TRIX (15,9): | 0.0500 | |
| Courbe Coppock: | 1.77 |
| MA7: | 48.86 | |
| MA20: | 46.25 | |
| MA50: | 43.59 | |
| MA100: | 39.45 | |
| MAexp7: | 49.28 | |
| MAexp20: | 48.93 | |
| MAexp50: | 48.31 | |
| MAexp100: | 47.27 | |
| Price / MA7: | +2.21% | |
| Price / MA20: | +7.98% | |
| Price / MA50: | +14.57% | |
| Price / MA100: | +26.59% | |
| Price / MAexp7: | +1.34% | |
| Price / MAexp20: | +2.06% | |
| Price / MAexp50: | +3.37% | |
| Price / MAexp100: | +5.65% |
About author
Online


Add a comment
Comments
0 comments on the analysis TRIP.COM GROUP LTD. - 1H