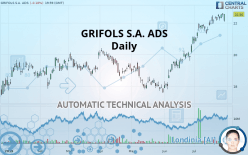
GRIFOLS S.A. ADS - Daily - Technical analysis published on 07/31/2019 (GMT)
- Who voted?
- 207
- 0
Click here for a new analysis!
- Timeframe : Daily
- - Analysis generated on
- Status : TARGET REACHED

Summary of the analysis

Additional analysis
Quotes
The GRIFOLS S.A. ADS price is 22.56 USD. On the day, this instrument lost -0.18% and was traded between 22.08 USD and 22.59 USD over the period. The price is currently at +2.17% from its lowest and -0.13% from its highest.The Central Gaps scanner detects a bearish gap which is a sign that the sellers have taken the lead in the very short term.
Opening Gap DOWN
Type : Bearish
Timeframe : Openning
A study of price movements over other periods shows the following variations:
Near a new HIGH record (1 year)
Type : Bullish
Timeframe : Weekly
Near a new HIGH record (1st january)
Type : Bullish
Timeframe : Weekly
Near a new HIGH record (1 month)
Type : Bullish
Timeframe : Weekly
The Central Volumes scanner notes the presence of abnormal volumes:
Abnormal volumes
Timeframe : 20 days
Technical
Technical analysis of this Daily chart of GRIFOLS S.A. ADS indicates that the overall trend is strongly bullish. The signals given by the moving averages are 92.86% bullish. This strong bullish trend is confirmed by the strong signals currently being given by short-term moving averages. There is no crossing of moving average by the price or crossing of moving averages between themselves.
The probability of a further increase are moderate given the direction of the technical indicators.
But beware of excesses. The Central Indicators scanner currently detects this:
RSI indicator is overbought : over 70
Type : Neutral
Timeframe : Daily
CCI indicator is overbought : over 100
Type : Neutral
Timeframe : Daily
Williams %R indicator is overbought : over -20
Type : Neutral
Timeframe : Daily
Price is back over the pivot point
Type : Bullish
Timeframe : Daily
Price is back over the pivot point
Type : Bullish
Timeframe : Weekly
Central Patterns, the market scanner focusing on chart patterns, resistances and supports found these results:
Near horizontal resistance
Type : Bearish
Timeframe : Daily
Near resistance of channel
Type : Bearish
Timeframe : Daily
The Central Candlesticks scanner which studies Japanese candlesticks did not detect anything.
| S3 | S2 | S1 | Price | R1 | R2 | R3 | |
|---|---|---|---|---|---|---|---|
| ProTrendLines | 19.78 | 20.23 | 21.50 | 22.56 | 22.58 | 23.89 | 24.95 |
| Change (%) | -12.32% | -10.33% | -4.70% | - | +0.09% | +5.90% | +10.59% |
| Change | -2.78 | -2.33 | -1.06 | - | +0.02 | +1.33 | +2.39 |
| Level | Major | Intermediate | Major | - | Intermediate | Minor | Major |
Attention could also be paid to pivot points to set price objectives:
| Pivot points | S3 | S2 | S1 | PP | R1 | R2 | R3 |
|---|---|---|---|---|---|---|---|
| Standard | 22.21 | 22.30 | 22.45 | 22.55 | 22.70 | 22.79 | 22.94 |
| Camarilla | 22.53 | 22.56 | 22.58 | 22.60 | 22.62 | 22.65 | 22.67 |
| Woodie | 22.23 | 22.31 | 22.48 | 22.56 | 22.72 | 22.80 | 22.97 |
| Fibonacci | 22.30 | 22.39 | 22.45 | 22.55 | 22.64 | 22.70 | 22.79 |
| Pivot points | S3 | S2 | S1 | PP | R1 | R2 | R3 |
|---|---|---|---|---|---|---|---|
| Standard | 21.82 | 21.98 | 22.26 | 22.42 | 22.70 | 22.86 | 23.14 |
| Camarilla | 22.42 | 22.46 | 22.50 | 22.54 | 22.58 | 22.62 | 22.66 |
| Woodie | 21.88 | 22.01 | 22.32 | 22.45 | 22.76 | 22.89 | 23.20 |
| Fibonacci | 21.98 | 22.15 | 22.26 | 22.42 | 22.59 | 22.70 | 22.86 |
| Pivot points | S3 | S2 | S1 | PP | R1 | R2 | R3 |
|---|---|---|---|---|---|---|---|
| Standard | 15.52 | 16.66 | 18.88 | 20.02 | 22.24 | 23.38 | 25.60 |
| Camarilla | 20.18 | 20.48 | 20.79 | 21.10 | 21.41 | 21.72 | 22.02 |
| Woodie | 16.06 | 16.93 | 19.42 | 20.29 | 22.78 | 23.65 | 26.14 |
| Fibonacci | 16.66 | 17.94 | 18.74 | 20.02 | 21.30 | 22.10 | 23.38 |
Numerical data
The following is the status of technical indicators and moving averages registered at the time this technical analysis was created:
| RSI (14): | 70.88 | |
| MACD (12,26,9): | 0.6300 | |
| Directional Movement: | 13.96 | |
| AROON (14): | 78.57 | |
| DEMA (21): | 22.72 | |
| Parabolic SAR (0,02-0,02-0,2): | 22.64 | |
| Elder Ray (13): | 0.17 | |
| Super Trend (3,10): | 21.46 | |
| Zig ZAG (10): | 22.56 | |
| VORTEX (21): | 1.0600 | |
| Stochastique (14,3,5): | 95.85 | |
| TEMA (21): | 22.80 | |
| Williams %R (14): | -5.97 | |
| Chande Momentum Oscillator (20): | 1.18 | |
| Repulse (5,40,3): | 3.2300 | |
| ROCnROLL: | 1 | |
| TRIX (15,9): | 0.4800 | |
| Courbe Coppock: | 8.19 |
| MA7: | 22.44 | |
| MA20: | 21.97 | |
| MA50: | 20.24 | |
| MA100: | 19.69 | |
| MAexp7: | 22.41 | |
| MAexp20: | 21.86 | |
| MAexp50: | 20.81 | |
| MAexp100: | 20.15 | |
| Price / MA7: | +0.53% | |
| Price / MA20: | +2.69% | |
| Price / MA50: | +11.46% | |
| Price / MA100: | +14.58% | |
| Price / MAexp7: | +0.67% | |
| Price / MAexp20: | +3.20% | |
| Price / MAexp50: | +8.41% | |
| Price / MAexp100: | +11.96% |
News
Don"t forget to follow the news on GRIFOLS S.A. ADS. At the time of publication of this analysis, the latest news was as follows:
- Grifols Misterium® Cleanroom Solutions Expands to Include Revolutionary Decontamination Air and Surface Disinfection Systems for Pharmaceutical Preparation
- Grifols Phocus Rx® Pharmacy Workflow Management Solution Now Integrates With Top Hospital Information Systems via HL7 Interfaces
- Select American Red Cross Blood Donations Screened for Babesia Parasite Using Grifols' Procleix Babesia Assay Under an Investigational New Drug Protocol
- Grifols Continues to Strengthen its Diagnostic Division by Launching New Global Testing Services for the Measurement of Biological Drug Levels and Anti-Drug Immune Response in Blood Samples
- Grifols and Beckman Coulter Enter into an Exclusive Distribution Agreement
About author

Online


Add a comment
Comments
0 comments on the analysis GRIFOLS S.A. ADS - Daily