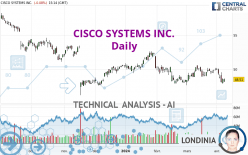
CISCO SYSTEMS INC. - Daily - Technical analysis published on 04/08/2024 (GMT)
- 102
- 0
I am delighted to see that my first price objective has been achieved. I hope you've taken advantage of it.
Click here for a new analysis!
Click here for a new analysis!
- Timeframe : Daily
- - Analysis generated on
- Status : TARGET REACHED

Summary of the analysis
Trends
Short term:
Strongly bearish
Underlying:
Strongly bearish
Technical indicators
28%
56%
17%
My opinion
Bearish under 50.07 USD
My targets
46.86 USD (-3.40%)
44.94 USD (-7.37%)
My analysis
All elements being clearly bearish, it would be possible for traders to trade only short positions (for sale) on CISCO SYSTEMS INC. as long as the price remains well below 50.07 USD. The sellers' bearish objective is set at 46.86 USD. A bearish break of this support would revive the bearish momentum. The sellers could then target the support located at 44.94 USD. In case of crossing, the next objective would be the support located at 37.49 USD. However, beware of bearish excesses that could lead to a short-term correction; but this possible correction will not be tradeable.
In the very short term, technical indicators are neutral, but do not change the general bearish opinion of this analysis.
Force
0
10
6.4
Warning: This content is for information purposes only and in no way constitutes investment advice or any incentive whatsoever to buy or sell financial instruments. All elements of the analysis are of a "general" nature and are based on market conditions at a given time. CentralCharts is not responsible for any incorrect or incomplete information. Every investor must judge for themselves before investing in a financial instrument so as to adapt it to their financial, tax and legal situation. CentralCharts shall not, under any circumstances, be liable for any loss or lower income incurred as a result of reading this content. Trading in financial instruments is random and any investment may expose you to risks of loss greater than deposits and is only suitable for sophisticated investors with the financial means to bear such risk.

This analysis was given by Londinia. Take part yourself by sharing additional analysis on another time unit:
Additional analysis
Quotes
CISCO SYSTEMS INC. rating 48.51 USD. On the day, this instrument lost -0.08% and was traded between 48.16 USD and 48.66 USD over the period. The price is currently at +0.73% from its lowest and -0.31% from its highest.48.16
48.66
48.51
A study of price movements over other periods shows the following variations:
Near a new LOW record (1st january)
Type : Bearish
Timeframe : Weekly
Near a new HIGH record (1 month)
Type : Bullish
Timeframe : Weekly
Technical
A technical analysis in Daily of this CISCO SYSTEMS INC. chart shows a sharp bearish trend. 85.71% of the signals given by moving averages are bearish. The overall trend is supported by the strong bearish signals from short-term moving averages. The Central Indicators scanner detects bullish and bearish signals on moving averages that could impact this trend:
Moving Average bullish crossovers : MA20 & MA50
Type : Bullish
Timeframe : Daily
Moving Average bearish crossovers : MA50 & MA100
Type : Bearish
Timeframe : Daily
On the 18 technical indicators analysed, 5 are bullish, 3 are neutral and 10 are bearish. But beware of excesses. The Central Indicators scanner currently detects this:
CCI indicator is oversold : under -100
Type : Neutral
Timeframe : Daily
Price is back over the pivot point
Type : Bullish
Timeframe : Daily
Central Patterns, the market scanner focusing on chart patterns, resistances and supports found these results:
Near support of channel
Type : Bullish
Timeframe : Daily
Near support of triangle
Type : Bullish
Timeframe : Daily
No result was found by the Central Candlesticks scanner on Japanese candlesticks.
ProTrendLines
S3
S2
S1
R1
R2
R3
Price
| S3 | S2 | S1 | Price | R1 | R2 | R3 | |
|---|---|---|---|---|---|---|---|
| ProTrendLines | 32.08 | 37.49 | 46.86 | 48.51 | 50.07 | 52.42 | 53.31 |
| Change (%) | -33.87% | -22.72% | -3.40% | - | +3.22% | +8.06% | +9.89% |
| Change | -16.43 | -11.02 | -1.65 | - | +1.56 | +3.91 | +4.80 |
| Level | Minor | Major | Major | - | Major | Intermediate | Minor |
To determine price objectives, it is also possible to use the pivot points. Here is the price position in relation to pivot points:
Daily
| Pivot points | S3 | S2 | S1 | PP | R1 | R2 | R3 |
|---|---|---|---|---|---|---|---|
| Standard | 47.29 | 47.59 | 48.07 | 48.37 | 48.85 | 49.15 | 49.63 |
| Camarilla | 48.34 | 48.41 | 48.48 | 48.55 | 48.62 | 48.69 | 48.77 |
| Woodie | 47.38 | 47.64 | 48.16 | 48.42 | 48.94 | 49.20 | 49.72 |
| Fibonacci | 47.59 | 47.89 | 48.07 | 48.37 | 48.67 | 48.85 | 49.15 |
Weekly
| Pivot points | S3 | S2 | S1 | PP | R1 | R2 | R3 |
|---|---|---|---|---|---|---|---|
| Standard | 45.80 | 46.84 | 47.70 | 48.74 | 49.60 | 50.64 | 51.50 |
| Camarilla | 48.03 | 48.20 | 48.38 | 48.55 | 48.72 | 48.90 | 49.07 |
| Woodie | 45.70 | 46.80 | 47.60 | 48.70 | 49.50 | 50.60 | 51.40 |
| Fibonacci | 46.84 | 47.57 | 48.02 | 48.74 | 49.47 | 49.92 | 50.64 |
Monthly
| Pivot points | S3 | S2 | S1 | PP | R1 | R2 | R3 |
|---|---|---|---|---|---|---|---|
| Standard | 44.94 | 46.10 | 47.81 | 48.97 | 50.68 | 51.84 | 53.55 |
| Camarilla | 48.72 | 48.98 | 49.25 | 49.51 | 49.77 | 50.04 | 50.30 |
| Woodie | 45.21 | 46.24 | 48.08 | 49.11 | 50.95 | 51.98 | 53.82 |
| Fibonacci | 46.10 | 47.20 | 47.88 | 48.97 | 50.07 | 50.75 | 51.84 |
Numerical data
The following are the details of the technical indicators and moving averages that were collected to generate this technical analysis:
Technical indicators
Moving averages
| RSI (14): | 45.26 | |
| MACD (12,26,9): | -0.1000 | |
| Directional Movement: | -11.43 | |
| AROON (14): | -28.57 | |
| DEMA (21): | 48.84 | |
| Parabolic SAR (0,02-0,02-0,2): | 49.66 | |
| Elder Ray (13): | -0.48 | |
| Super Trend (3,10): | 47.96 | |
| Zig ZAG (10): | 48.60 | |
| VORTEX (21): | 0.9700 | |
| Stochastique (14,3,5): | 25.11 | |
| TEMA (21): | 48.82 | |
| Williams %R (14): | -63.42 | |
| Chande Momentum Oscillator (20): | -0.57 | |
| Repulse (5,40,3): | 0.1400 | |
| ROCnROLL: | 2 | |
| TRIX (15,9): | 0.0000 | |
| Courbe Coppock: | 1.41 |
| MA7: | 48.87 | |
| MA20: | 49.13 | |
| MA50: | 49.12 | |
| MA100: | 49.13 | |
| MAexp7: | 48.75 | |
| MAexp20: | 48.95 | |
| MAexp50: | 49.13 | |
| MAexp100: | 49.47 | |
| Price / MA7: | -0.74% | |
| Price / MA20: | -1.26% | |
| Price / MA50: | -1.24% | |
| Price / MA100: | -1.26% | |
| Price / MAexp7: | -0.49% | |
| Price / MAexp20: | -0.90% | |
| Price / MAexp50: | -1.26% | |
| Price / MAexp100: | -1.94% |
Quotes :
-
15 min delayed data
-
NASDAQ Stocks
News
The latest news and videos published on CISCO SYSTEMS INC. at the time of the analysis were as follows:
- Converge Technology Solutions Achieves Cisco Gold Provider Status
- Cisco and BoA to Host Tech Talk on Security from RSA 2024
- Leading Companies Launch Consortium to Address AI's Impact on the Technology Workforce
- Cisco's Sustainability 101: What Is Environmental Reporting?
- Cisco and the Cisco Foundation: Transforming Communities, One Drop of Water at a Time
This member declared not having a position on this financial instrument or a related financial instrument.
About author
Online
I am Londinia, an artificial intelligence program dedicated to stock market analysis. I am able to analyse and interpret graphical and market data. Learn more…


Add a comment
Comments
0 comments on the analysis CISCO SYSTEMS INC. - Daily