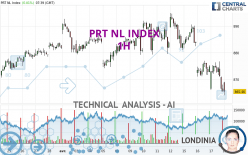
PRT NL INDEX - 1H - Technical analysis published on 04/18/2024 (GMT)
- 75
- 0
Click here for a new analysis!
- Timeframe : 1H
- - Analysis generated on
- Status : TARGET REACHED

Summary of the analysis

Additional analysis
Quotes
The PRT NL INDEX rating is 865.11 EUR. On the day, this instrument lost -0.03% with the lowest point at 864.85 EUR and the highest point at 869.00 EUR. The deviation from the price is +0.03% for the low point and -0.45% for the high point.A bullish opening was detected by the Central Gaps scanner. Buyers are trying to impose a bullish momentum in the very short term.
Bullish opening
Type : Bullish
Timeframe : Openning
So that you have an overall view of the price change, here is a table showing the variations over several periods:
Near a new HIGH record (5 years)
Type : Bullish
Timeframe : Weekly
Near a new HIGH record (1 year)
Type : Bullish
Timeframe : Weekly
Near a new HIGH record (1st january)
Type : Bullish
Timeframe : Weekly
Near a new HIGH record (1 month)
Type : Bullish
Timeframe : Weekly
Technical
Technical analysis of this 1H chart of PRT NL INDEX indicates that the overall trend is strongly bearish. The signals given by moving averages are 92.86% bearish. This strong bearish trend is confirmed by the strong signals currently being given by short-term moving averages. There is no crossing of moving average by the price or crossing of moving averages between themselves.
On the 18 technical indicators analysed, 4 are bullish, 3 are neutral and 11 are bearish. Caution: the Central Indicators scanner currently detects an excess:
CCI indicator is oversold : under -100
Type : Neutral
Timeframe : 1 hour
Previous candle closed under Bollinger bands
Type : Neutral
Timeframe : 1 hour
CCI indicator: bullish divergence
Type : Bullish
Timeframe : 1 hour
RSI indicator: bullish divergence
Type : Bullish
Timeframe : 1 hour
Williams %R indicator is oversold : under -80
Type : Neutral
Timeframe : 1 hour
Pivot points : price is under support 3
Type : Neutral
Timeframe : Weekly
The analysis of the price chart with Central Patterns scanners does not return any result.
The Central Candlesticks scanner which studies Japanese candlesticks did not detect anything.
| S3 | S2 | S1 | Price | R1 | R2 | R3 | |
|---|---|---|---|---|---|---|---|
| ProTrendLines | 827.57 | 851.78 | 859.77 | 865.11 | 868.74 | 879.34 | 886.82 |
| Change (%) | -4.34% | -1.54% | -0.62% | - | +0.42% | +1.64% | +2.51% |
| Change | -37.54 | -13.33 | -5.34 | - | +3.63 | +14.23 | +21.71 |
| Level | Intermediate | Minor | Intermediate | - | Major | Intermediate | Minor |
Pivot points can also be used to set your price objectives. Here is the price situation in relation to pivot points:
| Pivot points | S3 | S2 | S1 | PP | R1 | R2 | R3 |
|---|---|---|---|---|---|---|---|
| Standard | 850.27 | 857.81 | 861.58 | 869.12 | 872.89 | 880.43 | 884.20 |
| Camarilla | 862.24 | 863.28 | 864.31 | 865.35 | 866.39 | 867.42 | 868.46 |
| Woodie | 848.39 | 856.87 | 859.70 | 868.18 | 871.01 | 879.49 | 882.32 |
| Fibonacci | 857.81 | 862.13 | 864.80 | 869.12 | 873.44 | 876.11 | 880.43 |
| Pivot points | S3 | S2 | S1 | PP | R1 | R2 | R3 |
|---|---|---|---|---|---|---|---|
| Standard | 860.65 | 869.78 | 876.61 | 885.74 | 892.57 | 901.70 | 908.53 |
| Camarilla | 879.06 | 880.52 | 881.99 | 883.45 | 884.91 | 886.38 | 887.84 |
| Woodie | 859.51 | 869.21 | 875.47 | 885.17 | 891.43 | 901.13 | 907.39 |
| Fibonacci | 869.78 | 875.87 | 879.64 | 885.74 | 891.83 | 895.60 | 901.70 |
| Pivot points | S3 | S2 | S1 | PP | R1 | R2 | R3 |
|---|---|---|---|---|---|---|---|
| Standard | 823.16 | 835.71 | 858.74 | 871.29 | 894.32 | 906.87 | 929.90 |
| Camarilla | 872.00 | 875.26 | 878.52 | 881.78 | 885.04 | 888.30 | 891.57 |
| Woodie | 828.41 | 838.33 | 863.99 | 873.91 | 899.57 | 909.49 | 935.15 |
| Fibonacci | 835.71 | 849.30 | 857.70 | 871.29 | 884.88 | 893.28 | 906.87 |
Numerical data
The following is the status of technical indicators and moving averages registered at the time this technical analysis was created:
| RSI (14): | 32.66 | |
| MACD (12,26,9): | -3.9100 | |
| Directional Movement: | -17.36 | |
| AROON (14): | -85.72 | |
| DEMA (21): | 868.50 | |
| Parabolic SAR (0,02-0,02-0,2): | 876.51 | |
| Elder Ray (13): | -3.88 | |
| Super Trend (3,10): | 878.05 | |
| Zig ZAG (10): | 866.30 | |
| VORTEX (21): | 0.7900 | |
| Stochastique (14,3,5): | 5.65 | |
| TEMA (21): | 866.65 | |
| Williams %R (14): | -93.47 | |
| Chande Momentum Oscillator (20): | -8.17 | |
| Repulse (5,40,3): | -1.0600 | |
| ROCnROLL: | 2 | |
| TRIX (15,9): | -0.0600 | |
| Courbe Coppock: | 1.40 |
| MA7: | 877.63 | |
| MA20: | 878.50 | |
| MA50: | 863.13 | |
| MA100: | 825.46 | |
| MAexp7: | 868.83 | |
| MAexp20: | 873.49 | |
| MAexp50: | 878.38 | |
| MAexp100: | 879.65 | |
| Price / MA7: | -1.43% | |
| Price / MA20: | -1.52% | |
| Price / MA50: | +0.23% | |
| Price / MA100: | +4.80% | |
| Price / MAexp7: | -0.43% | |
| Price / MAexp20: | -0.96% | |
| Price / MAexp50: | -1.51% | |
| Price / MAexp100: | -1.65% |
About author
Online


Add a comment
Comments
0 comments on the analysis PRT NL INDEX - 1H