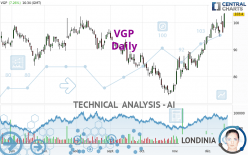
VGP - Daily - Technical analysis published on 12/19/2023 (GMT)
- 122
- 0
Click here for a new analysis!
- Timeframe : Daily
- - Analysis generated on
- Status : TARGET REACHED

Summary of the analysis

Additional analysis
Quotes
VGP rating 103.40 EUR. The price registered an increase of +7.26% on the session with the lowest point at 97.95 EUR and the highest point at 103.60 EUR. The deviation from the price is +5.56% for the low point and -0.19% for the high point.A bullish opening was detected by the Central Gaps scanner. Buyers are trying to impose a bullish momentum in the very short term.
Bullish opening
Type : Bullish
Timeframe : Openning
A study of price movements over other periods shows the following variations:
New HIGH record (1 year)
Type : Bullish
Timeframe : Weekly
New HIGH record (1st january)
Type : Bullish
Timeframe : Weekly
New HIGH record (1 month)
Type : Bullish
Timeframe : Weekly
Technical
Technical analysis of VGP in Daily shows a strongly overall bullish trend. The signals given by the moving averages are 89.29% bullish. This strong bullish trend is confirmed by the strong signals currently being given by short-term moving averages. The Central Indicators market scanner currently does not detect any result that concerns moving averages.
The probability of a further increase is high given the direction of the technical indicators.
Caution: the Central Indicators scanner currently detects an excess:
CCI indicator is overbought : over 100
Type : Neutral
Timeframe : Daily
Williams %R indicator is overbought : over -20
Type : Neutral
Timeframe : Daily
Pivot points : price is over resistance 1
Type : Neutral
Timeframe : Weekly
Pivot points : price is over resistance 3
Type : Neutral
Timeframe : Daily
MACD crosses UP its Moving Average
Type : Bullish
Timeframe : Daily
An analysis of the price chart with the Central Patterns scanner (detector of chart patterns and resistances and supports) shows several results that can have an impact on the price change:
Near horizontal resistance
Type : Bearish
Timeframe : Daily
Resistance of channel is broken
Type : Bullish
Timeframe : Daily
The Central Candlesticks scanner which studies Japanese candlesticks did not detect anything.
| S3 | S2 | S1 | Price | R1 | R2 | R3 | |
|---|---|---|---|---|---|---|---|
| ProTrendLines | 86.69 | 96.25 | 102.21 | 103.40 | 117.87 | 185.61 | 246.99 |
| Change (%) | -16.16% | -6.91% | -1.15% | - | +13.99% | +79.51% | +138.87% |
| Change | -16.71 | -7.15 | -1.19 | - | +14.47 | +82.21 | +143.59 |
| Level | Major | Intermediate | Major | - | Minor | Minor | Major |
Attention could also be paid to pivot points to set price objectives:
| Pivot points | S3 | S2 | S1 | PP | R1 | R2 | R3 |
|---|---|---|---|---|---|---|---|
| Standard | 94.05 | 96.00 | 99.70 | 101.65 | 105.35 | 107.30 | 111.00 |
| Camarilla | 101.85 | 102.36 | 102.88 | 103.40 | 103.92 | 104.44 | 104.95 |
| Woodie | 94.93 | 96.44 | 100.58 | 102.09 | 106.23 | 107.74 | 111.88 |
| Fibonacci | 96.00 | 98.16 | 99.49 | 101.65 | 103.81 | 105.14 | 107.30 |
| Pivot points | S3 | S2 | S1 | PP | R1 | R2 | R3 |
|---|---|---|---|---|---|---|---|
| Standard | 61.80 | 68.50 | 81.55 | 88.25 | 101.30 | 108.00 | 121.05 |
| Camarilla | 89.17 | 90.98 | 92.79 | 94.60 | 96.41 | 98.22 | 100.03 |
| Woodie | 64.98 | 70.09 | 84.73 | 89.84 | 104.48 | 109.59 | 124.23 |
| Fibonacci | 68.50 | 76.05 | 80.71 | 88.25 | 95.80 | 100.46 | 108.00 |
Numerical data
The following are the details of the technical indicators and moving averages that were collected to generate this technical analysis:
| RSI (14): | 68.42 | |
| MACD (12,26,9): | 3.9100 | |
| Directional Movement: | 21.99 | |
| AROON (14): | 100.00 | |
| DEMA (21): | 100.02 | |
| Parabolic SAR (0,02-0,02-0,2): | 94.96 | |
| Elder Ray (13): | 3.72 | |
| Super Trend (3,10): | 91.70 | |
| Zig ZAG (10): | 103.40 | |
| VORTEX (21): | 1.1200 | |
| Stochastique (14,3,5): | 77.59 | |
| TEMA (21): | 101.84 | |
| Williams %R (14): | -1.47 | |
| Chande Momentum Oscillator (20): | 8.80 | |
| Repulse (5,40,3): | 2.6000 | |
| ROCnROLL: | 1 | |
| TRIX (15,9): | 0.6400 | |
| Courbe Coppock: | 21.63 |
| MA7: | 98.76 | |
| MA20: | 94.42 | |
| MA50: | 86.34 | |
| MA100: | 88.95 | |
| MAexp7: | 98.93 | |
| MAexp20: | 94.95 | |
| MAexp50: | 90.33 | |
| MAexp100: | 89.06 | |
| Price / MA7: | +4.70% | |
| Price / MA20: | +9.51% | |
| Price / MA50: | +19.76% | |
| Price / MA100: | +16.25% | |
| Price / MAexp7: | +4.52% | |
| Price / MAexp20: | +8.90% | |
| Price / MAexp50: | +14.47% | |
| Price / MAexp100: | +16.10% |
News
Don't forget to follow the news on VGP. At the time of publication of this analysis, the latest news was as follows:
- VGP Unveils New € 1.5 Billion 50:50 Joint Venture
- VGP Trading Update
- VGP Acquires an Iconic Land Plot Just a Few Minutes From Central Paris to Develop a 19-hectare Business Park
- Veterinary Growth Partners Selects Synchrony's CareCredit as Financing Solution for Members
- VGP NV: Voting Rights and Denominator
About author
Online


Add a comment
Comments
0 comments on the analysis VGP - Daily