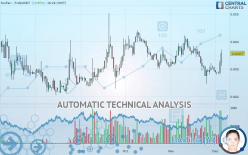
FUN TOKEN - FUN/USDT - Daily - Technical analysis published on 12/05/2019 (GMT)
- Who voted?
- 183
- 0
Click here for a new analysis!
- Timeframe : Daily
- - Analysis generated on
- Status : TARGET REACHED

Summary of the analysis

Additional analysis
Quotes
The FUNFAIR - FUN/USDT price is 0.003570 USDT. The price registered an increase of +10.90% on the session and was traded between 0.003102 USDT and 0.003705 USDT over the period. The price is currently at +15.09% from its lowest and -3.64% from its highest.Here is a more detailed summary of the historical variations registered by FUNFAIR - FUN/USDT:
Abnormal volumes
Timeframe : 5 days
Abnormal volumes
Timeframe : 20 days
Abnormal volumes
Timeframe : 50 days
Technical
A technical analysis in Daily of this FUNFAIR - FUN/USDT chart shows a bullish trend. 75% of the signals given by moving averages are bullish. This bullish trend is supported by the strong bullish signals given by short-term moving averages. The Central Indicators market scanner is currently detecting several bullish signals that could impact this trend:
Bullish trend reversal : adaptative moving average 20
Type : Bullish
Timeframe : Daily
Bullish price crossover with Moving Average 20
Type : Bullish
Timeframe : Daily
Bullish price crossover with adaptative moving average 20
Type : Bullish
Timeframe : Daily
In fact, 12 technical indicators on 18 studied are currently positioned bullish. Caution: the Central Indicators scanner currently detects an excess:
RSI indicator: bullish divergence
Type : Bullish
Timeframe : Daily
Williams %R indicator is overbought : over -20
Type : Neutral
Timeframe : Daily
Pivot points : price is over resistance 1
Type : Neutral
Timeframe : Daily
Pivot points : price is over resistance 1
Type : Neutral
Timeframe : Weekly
RSI indicator is back over 50
Type : Bullish
Timeframe : Daily
MACD crosses UP its Moving Average
Type : Bullish
Timeframe : Daily
Parabolic SAR indicator bullish reversal
Type : Bullish
Timeframe : Daily
Momentum indicator is back over 0
Type : Bullish
Timeframe : Daily
Williams %R indicator is back over -50
Type : Bullish
Timeframe : Daily
The Central Patterns scanner, which studies chart patterns, resistances and supports, has identified these signals:
Horizontal resistance is broken
Type : Bullish
Timeframe : Daily
Resistance of channel is broken
Type : Bullish
Timeframe : Daily
The Central Candlesticks scanner which studies Japanese candlesticks did not detect anything.
| S3 | S2 | S1 | Price | R1 | R2 | R3 | |
|---|---|---|---|---|---|---|---|
| ProTrendLines | 0.002177 | 0.002769 | 0.003109 | 0.003570 | 0.004326 | 0.005662 | 0.006487 |
| Change (%) | -39.02% | -22.44% | -12.91% | - | +21.18% | +58.60% | +81.71% |
| Change | -0.001393 | -0.000801 | -0.000461 | - | +0.000756 | +0.002092 | +0.002917 |
| Level | Minor | Major | Intermediate | - | Intermediate | Intermediate | Intermediate |
Pivot points can also be used to set your price objectives. Here is the price situation in relation to pivot points:
| Pivot points | S3 | S2 | S1 | PP | R1 | R2 | R3 |
|---|---|---|---|---|---|---|---|
| Standard | 0.002392 | 0.002595 | 0.002907 | 0.003110 | 0.003422 | 0.003625 | 0.003937 |
| Camarilla | 0.003077 | 0.003125 | 0.003172 | 0.003219 | 0.003266 | 0.003313 | 0.003361 |
| Woodie | 0.002447 | 0.002622 | 0.002962 | 0.003137 | 0.003477 | 0.003652 | 0.003992 |
| Fibonacci | 0.002595 | 0.002792 | 0.002913 | 0.003110 | 0.003307 | 0.003428 | 0.003625 |
| Pivot points | S3 | S2 | S1 | PP | R1 | R2 | R3 |
|---|---|---|---|---|---|---|---|
| Standard | 0.001786 | 0.002119 | 0.002537 | 0.002870 | 0.003288 | 0.003621 | 0.004039 |
| Camarilla | 0.002749 | 0.002817 | 0.002886 | 0.002955 | 0.003024 | 0.003093 | 0.003162 |
| Woodie | 0.001829 | 0.002140 | 0.002580 | 0.002891 | 0.003331 | 0.003642 | 0.004082 |
| Fibonacci | 0.002119 | 0.002406 | 0.002583 | 0.002870 | 0.003157 | 0.003334 | 0.003621 |
| Pivot points | S3 | S2 | S1 | PP | R1 | R2 | R3 |
|---|---|---|---|---|---|---|---|
| Standard | 0.000423 | 0.001438 | 0.002196 | 0.003211 | 0.003969 | 0.004984 | 0.005742 |
| Camarilla | 0.002467 | 0.002630 | 0.002793 | 0.002955 | 0.003118 | 0.003280 | 0.003443 |
| Woodie | 0.000296 | 0.001374 | 0.002069 | 0.003147 | 0.003842 | 0.004920 | 0.005615 |
| Fibonacci | 0.001438 | 0.002115 | 0.002533 | 0.003211 | 0.003888 | 0.004306 | 0.004984 |
Numerical data
The following are the details of the technical indicators and moving averages that were collected to generate this technical analysis:
| RSI (14): | 59.90 | |
| MACD (12,26,9): | -0.0001 | |
| Directional Movement: | 6.995054 | |
| AROON (14): | 71.428572 | |
| DEMA (21): | 0.003039 | |
| Parabolic SAR (0,02-0,02-0,2): | 0.002469 | |
| Elder Ray (13): | 0.000274 | |
| Super Trend (3,10): | 0.002563 | |
| Zig ZAG (10): | 0.003576 | |
| VORTEX (21): | 0.9034 | |
| Stochastique (14,3,5): | 65.99 | |
| TEMA (21): | 0.003013 | |
| Williams %R (14): | -10.30 | |
| Chande Momentum Oscillator (20): | 0.000478 | |
| Repulse (5,40,3): | 21.8085 | |
| ROCnROLL: | 1 | |
| TRIX (15,9): | -0.6177 | |
| Courbe Coppock: | 15.14 |
| MA7: | 0.003062 | |
| MA20: | 0.003172 | |
| MA50: | 0.003364 | |
| MA100: | 0.003320 | |
| MAexp7: | 0.003152 | |
| MAexp20: | 0.003181 | |
| MAexp50: | 0.003312 | |
| MAexp100: | 0.003412 | |
| Price / MA7: | +16.59% | |
| Price / MA20: | +12.55% | |
| Price / MA50: | +6.12% | |
| Price / MA100: | +7.53% | |
| Price / MAexp7: | +13.26% | |
| Price / MAexp20: | +12.23% | |
| Price / MAexp50: | +7.79% | |
| Price / MAexp100: | +4.63% |
About author

Online


Add a comment
Comments
0 comments on the analysis FUN TOKEN - FUN/USDT - Daily