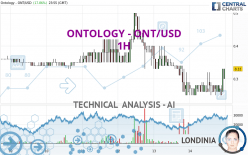
ONTOLOGY - ONT/USD - 1H - Technical analysis published on 04/14/2024 (GMT)
- 105
- 0
Click here for a new analysis!
- Timeframe : 1H
- - Analysis generated on
- Status : TARGET REACHED

Summary of the analysis

Additional analysis
Quotes
The ONTOLOGY - ONT/USD rating is 0.330000 USD. The price registered an increase of +17.86% on the session with the lowest point at 0.250000 USD and the highest point at 0.330000 USD. The deviation from the price is +32.00% for the low point and 0% for the high point.The Central Gaps scanner detects a bearish opening marking the presence of sellers ahead of buyers at the opening but not sufficiently marked to allow the price to register a quotation gap.
Bearish opening
Type : Bearish
Timeframe : Openning
A study of price movements over other periods shows the following variations:
New LOW record (1 month)
Type : Bearish
Timeframe : Weekly
The Central Volumes scanner notes the presence of abnormal volumes:
Abnormal volumes
Timeframe : 5 days
Abnormal volumes
Timeframe : 20 days
Abnormal volumes
Timeframe : 50 days
Technical
A technical analysis in 1H of this ONTOLOGY - ONT/USD chart shows a slightly bearish trend. 60.71% of the signals given by moving averages are bearish. Caution: the strong bullish signals currently being given by short-term moving averages indicate that this slightly bearish trend could quickly be reversed. The Central Indicators scanner detects bullish and bearish signals on moving averages that could impact this trend:
Bullish trend reversal : adaptative moving average 20
Type : Bullish
Timeframe : 1 hour
Bullish trend reversal : adaptative moving average 50
Type : Bullish
Timeframe : 1 hour
Bearish price crossover with Moving Average 50
Type : Bearish
Timeframe : 1 hour
Bearish price crossover with adaptative moving average 50
Type : Bearish
Timeframe : 1 hour
In fact, 11 technical indicators on 18 studied are currently positioned bullish. Caution: the Central Indicators scanner currently detects an excess:
CCI indicator is overbought : over 100
Type : Neutral
Timeframe : 1 hour
Previous candle closed over Bollinger bands
Type : Neutral
Timeframe : 1 hour
The analysis of the price chart with Central Patterns scanners does not return any result.
The Central Candlesticks scanner which studies Japanese candlesticks did not detect anything.
| S3 | S2 | S1 | Price | R1 | R2 | R3 | |
|---|---|---|---|---|---|---|---|
| ProTrendLines | 0.202105 | 0.260000 | 0.307500 | 0.330000 | 0.350000 | 0.370000 | 0.390000 |
| Change (%) | -38.76% | -21.21% | -6.82% | - | +6.06% | +12.12% | +18.18% |
| Change | -0.127895 | -0.070000 | -0.022500 | - | +0.020000 | +0.040000 | +0.060000 |
| Level | Major | Intermediate | Intermediate | - | Intermediate | Minor | Intermediate |
Attention could also be paid to pivot points to set price objectives:
| Pivot points | S3 | S2 | S1 | PP | R1 | R2 | R3 |
|---|---|---|---|---|---|---|---|
| Standard | 0.070000 | 0.160000 | 0.220000 | 0.310000 | 0.370000 | 0.460000 | 0.520000 |
| Camarilla | 0.238750 | 0.252500 | 0.266250 | 0.280000 | 0.293750 | 0.307500 | 0.321250 |
| Woodie | 0.055000 | 0.152500 | 0.205000 | 0.302500 | 0.355000 | 0.452500 | 0.505000 |
| Fibonacci | 0.160000 | 0.217300 | 0.252700 | 0.310000 | 0.367300 | 0.402700 | 0.460000 |
| Pivot points | S3 | S2 | S1 | PP | R1 | R2 | R3 |
|---|---|---|---|---|---|---|---|
| Standard | -0.063333 | 0.093333 | 0.186667 | 0.343333 | 0.436667 | 0.593333 | 0.686667 |
| Camarilla | 0.211250 | 0.234167 | 0.257083 | 0.280000 | 0.302917 | 0.325833 | 0.348750 |
| Woodie | -0.095000 | 0.077500 | 0.155000 | 0.327500 | 0.405000 | 0.577500 | 0.655000 |
| Fibonacci | 0.093333 | 0.188833 | 0.247833 | 0.343333 | 0.438833 | 0.497833 | 0.593333 |
| Pivot points | S3 | S2 | S1 | PP | R1 | R2 | R3 |
|---|---|---|---|---|---|---|---|
| Standard | 0.120000 | 0.200000 | 0.280000 | 0.360000 | 0.440000 | 0.520000 | 0.600000 |
| Camarilla | 0.316000 | 0.330667 | 0.345333 | 0.360000 | 0.374667 | 0.389333 | 0.404000 |
| Woodie | 0.120000 | 0.200000 | 0.280000 | 0.360000 | 0.440000 | 0.520000 | 0.600000 |
| Fibonacci | 0.200000 | 0.261120 | 0.298880 | 0.360000 | 0.421120 | 0.458880 | 0.520000 |
Numerical data
The following are the details of the technical indicators and moving averages that were collected to generate this technical analysis:
| RSI (14): | 53.29 | |
| MACD (12,26,9): | -0.0009 | |
| Directional Movement: | 11.229866 | |
| AROON (14): | 57.142857 | |
| DEMA (21): | 0.273726 | |
| Parabolic SAR (0,02-0,02-0,2): | 0.250000 | |
| Elder Ray (13): | 0.033324 | |
| Super Trend (3,10): | 0.350113 | |
| Zig ZAG (10): | 0.300000 | |
| VORTEX (21): | 1.0625 | |
| Stochastique (14,3,5): | 54.17 | |
| TEMA (21): | 0.285705 | |
| Williams %R (14): | -37.50 | |
| Chande Momentum Oscillator (20): | 0.040000 | |
| Repulse (5,40,3): | 9.1663 | |
| ROCnROLL: | -1 | |
| TRIX (15,9): | -0.5063 | |
| Courbe Coppock: | 12.03 |
| MA7: | 0.358571 | |
| MA20: | 0.344000 | |
| MA50: | 0.335800 | |
| MA100: | 0.288600 | |
| MAexp7: | 0.294552 | |
| MAexp20: | 0.282133 | |
| MAexp50: | 0.303032 | |
| MAexp100: | 0.324147 | |
| Price / MA7: | -7.97% | |
| Price / MA20: | -4.07% | |
| Price / MA50: | -1.73% | |
| Price / MA100: | +14.35% | |
| Price / MAexp7: | +12.03% | |
| Price / MAexp20: | +16.97% | |
| Price / MAexp50: | +8.90% | |
| Price / MAexp100: | +1.81% |
About author
Online


Add a comment
Comments
0 comments on the analysis ONTOLOGY - ONT/USD - 1H