EASE2PAY NV - Daily - Technical analysis published on 11/24/2023 (GMT)
- 113
- 0
- Timeframe : Daily
- - Analysis generated on
- Status : NEUTRAL

Summary of the analysis

Additional analysis
Quotes
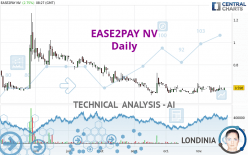
EASE2PAY NV rating 0.598 EUR. On the day, this instrument gained +2.75% with the lowest point at 0.580 EUR and the highest point at 0.598 EUR. The deviation from the price is +3.10% for the low point and 0% for the high point.The Central Gaps scanner detects a bearish gap which is a sign that the sellers have taken the lead in the very short term.
Opening Gap DOWN
Type : Bearish
Timeframe : Openning
So that you have an overall view of the price change, here is a table showing the variations over several periods:
Technical
A technical analysis in Daily of this EASE2PAY NV chart shows a slightly bearish trend. 57.14% of the signals given by moving averages are bearish. Caution: the slightly bullish signals currently given by short-term moving averages could cause a reversal of the trend. The Central Indicators scanner detects bullish signals on moving averages that could impact this trend:
Bullish price crossover with Moving Average 20
Type : Bullish
Timeframe : Daily
Bullish price crossover with Moving Average 50
Type : Bullish
Timeframe : Daily
Bullish price crossover with adaptative moving average 20
Type : Bullish
Timeframe : Daily
The technical indicators are bullish. There is still some doubt about the price increase.
But beware of excesses. The Central Indicators scanner currently detects this:
MACD indicator: bullish divergence
Type : Bullish
Timeframe : Daily
Pivot points : price is over resistance 3
Type : Neutral
Timeframe : Daily
RSI indicator is back over 50
Type : Bullish
Timeframe : Daily
MACD indicator is back over 0
Type : Bullish
Timeframe : Daily
Price is back over the pivot point
Type : Bullish
Timeframe : Weekly
Williams %R indicator is back over -50
Type : Bullish
Timeframe : Daily
Central Patterns, the market scanner focusing on chart patterns, resistances and supports found this result:
Near support of channel
Type : Bullish
Timeframe : Daily
Central Candlesticks, the scanner specialised in Japanese candlesticks, detects a bullish signal that could support the hypothesis of a small rebound in the very short term:
Bullish engulfing lines
Type : Bullish
Timeframe : Daily
| S1 | Price | R1 | R2 | R3 | |
|---|---|---|---|---|---|
| ProTrendLines | 0.553 | 0.598 | 0.780 | 1.065 | 1.480 |
| Change (%) | -7.53% | - | +30.43% | +78.09% | +147.49% |
| Change | -0.045 | - | +0.182 | +0.467 | +0.882 |
| Level | Intermediate | - | Major | Intermediate | Minor |
To determine price objectives, it is also possible to use the pivot points. Here is the price position in relation to pivot points:
| Pivot points | S3 | S2 | S1 | PP | R1 | R2 | R3 |
|---|---|---|---|---|---|---|---|
| Standard | 0.579 | 0.581 | 0.581 | 0.583 | 0.583 | 0.585 | 0.585 |
| Camarilla | 0.582 | 0.582 | 0.582 | 0.582 | 0.582 | 0.582 | 0.583 |
| Woodie | 0.579 | 0.581 | 0.581 | 0.583 | 0.583 | 0.585 | 0.585 |
| Fibonacci | 0.581 | 0.581 | 0.582 | 0.583 | 0.583 | 0.584 | 0.585 |
| Pivot points | S3 | S2 | S1 | PP | R1 | R2 | R3 |
|---|---|---|---|---|---|---|---|
| Standard | 0.483 | 0.517 | 0.543 | 0.577 | 0.603 | 0.637 | 0.663 |
| Camarilla | 0.554 | 0.559 | 0.565 | 0.570 | 0.576 | 0.581 | 0.587 |
| Woodie | 0.480 | 0.515 | 0.540 | 0.575 | 0.600 | 0.635 | 0.660 |
| Fibonacci | 0.517 | 0.540 | 0.554 | 0.577 | 0.600 | 0.614 | 0.637 |
| Pivot points | S3 | S2 | S1 | PP | R1 | R2 | R3 |
|---|---|---|---|---|---|---|---|
| Standard | 0.453 | 0.499 | 0.545 | 0.591 | 0.637 | 0.683 | 0.729 |
| Camarilla | 0.565 | 0.573 | 0.582 | 0.590 | 0.598 | 0.607 | 0.615 |
| Woodie | 0.452 | 0.499 | 0.544 | 0.591 | 0.636 | 0.683 | 0.728 |
| Fibonacci | 0.499 | 0.535 | 0.556 | 0.591 | 0.627 | 0.648 | 0.683 |
Numerical data
The following are the details of the technical indicators and moving averages that were collected to generate this technical analysis:
| RSI (14): | 53.36 | |
| MACD (12,26,9): | 0.0010 | |
| Directional Movement: | 13.193 | |
| AROON (14): | 42.857 | |
| DEMA (21): | 0.585 | |
| Parabolic SAR (0,02-0,02-0,2): | 0.623 | |
| Elder Ray (13): | 0.003 | |
| Super Trend (3,10): | 0.616 | |
| Zig ZAG (10): | 0.598 | |
| VORTEX (21): | 0.9340 | |
| Stochastique (14,3,5): | 60.95 | |
| TEMA (21): | 0.592 | |
| Williams %R (14): | -31.43 | |
| Chande Momentum Oscillator (20): | 0.008 | |
| Repulse (5,40,3): | 4.1480 | |
| ROCnROLL: | -1 | |
| TRIX (15,9): | -0.0080 | |
| Courbe Coppock: | 1.74 |
| MA7: | 0.585 | |
| MA20: | 0.587 | |
| MA50: | 0.584 | |
| MA100: | 0.651 | |
| MAexp7: | 0.588 | |
| MAexp20: | 0.585 | |
| MAexp50: | 0.600 | |
| MAexp100: | 0.669 | |
| Price / MA7: | +2.22% | |
| Price / MA20: | +1.87% | |
| Price / MA50: | +2.40% | |
| Price / MA100: | -8.14% | |
| Price / MAexp7: | +1.70% | |
| Price / MAexp20: | +2.22% | |
| Price / MAexp50: | -0.33% | |
| Price / MAexp100: | -10.61% |
News
Don't forget to follow the news on EASE2PAY NV. At the time of publication of this analysis, the latest news was as follows:
- EASE2PAY N.V. today publishes the 2021 annual report
- Ease2pay announces intended acquisition of Involtum and capital raise to accelerate growth
-
 DOCdata
About author
Online


Add a comment
Comments
0 comments on the analysis EASE2PAY NV - Daily